Overview
Around August 2018, a project came up in a meeting and about Skrill going into Cryptocurrency and adding it to its digital wallet with the option to buy certain coins within the wallet. Soon after the news, myself and a UI designer were assigned to it and began working on it. Currently it offers 9 cryptocurrencies that you can buy, send and soon withdraw. You can also set up auto orders, crypto reserves and schedule price alerts.
The crypto team initially started out very small and did not have a lot of dev man-power. Because of that there were limited front-end development and functionalities. In time this changed for the better, but the project went through more than 7 iterations before that happened.
Competitor Analysis
After receiving the task, I started doing some competitive analysis, looking at other digital wallets and creating a gallery of UI that could be used as inspiration later on. The top players in the field at that time were Coinbase, Binance, Coinome and KuCoin and I wanted to see how they work and get a feel for the crypto life. Up until that point I'd never dabbled with cryptocurrencies, but was definitely interested, so I invested a small amount of money to personally experience the process.
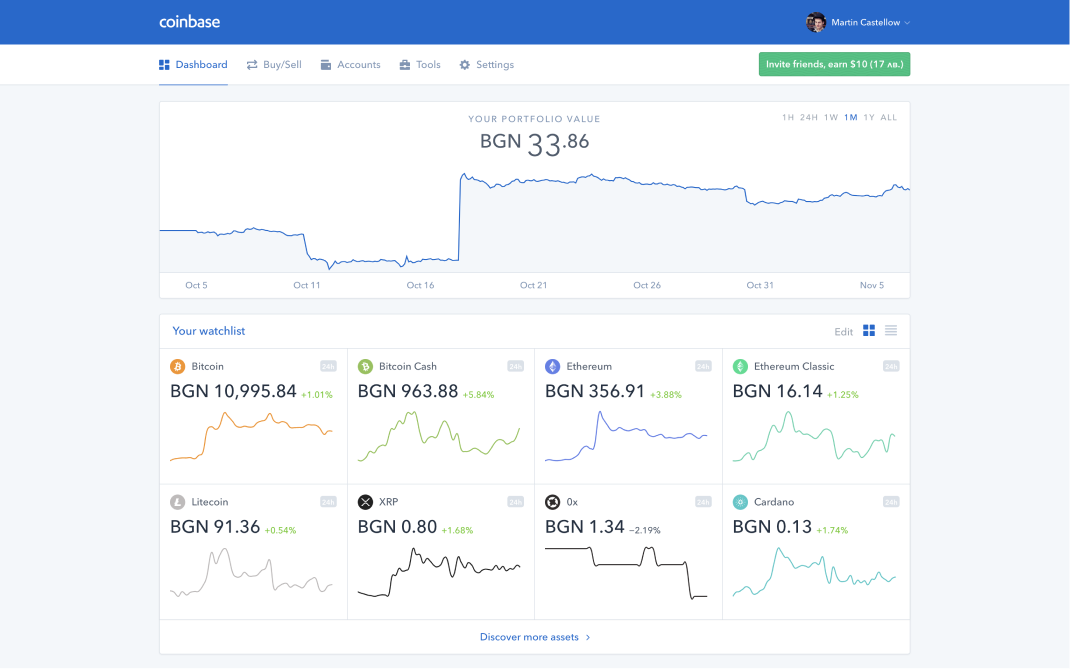
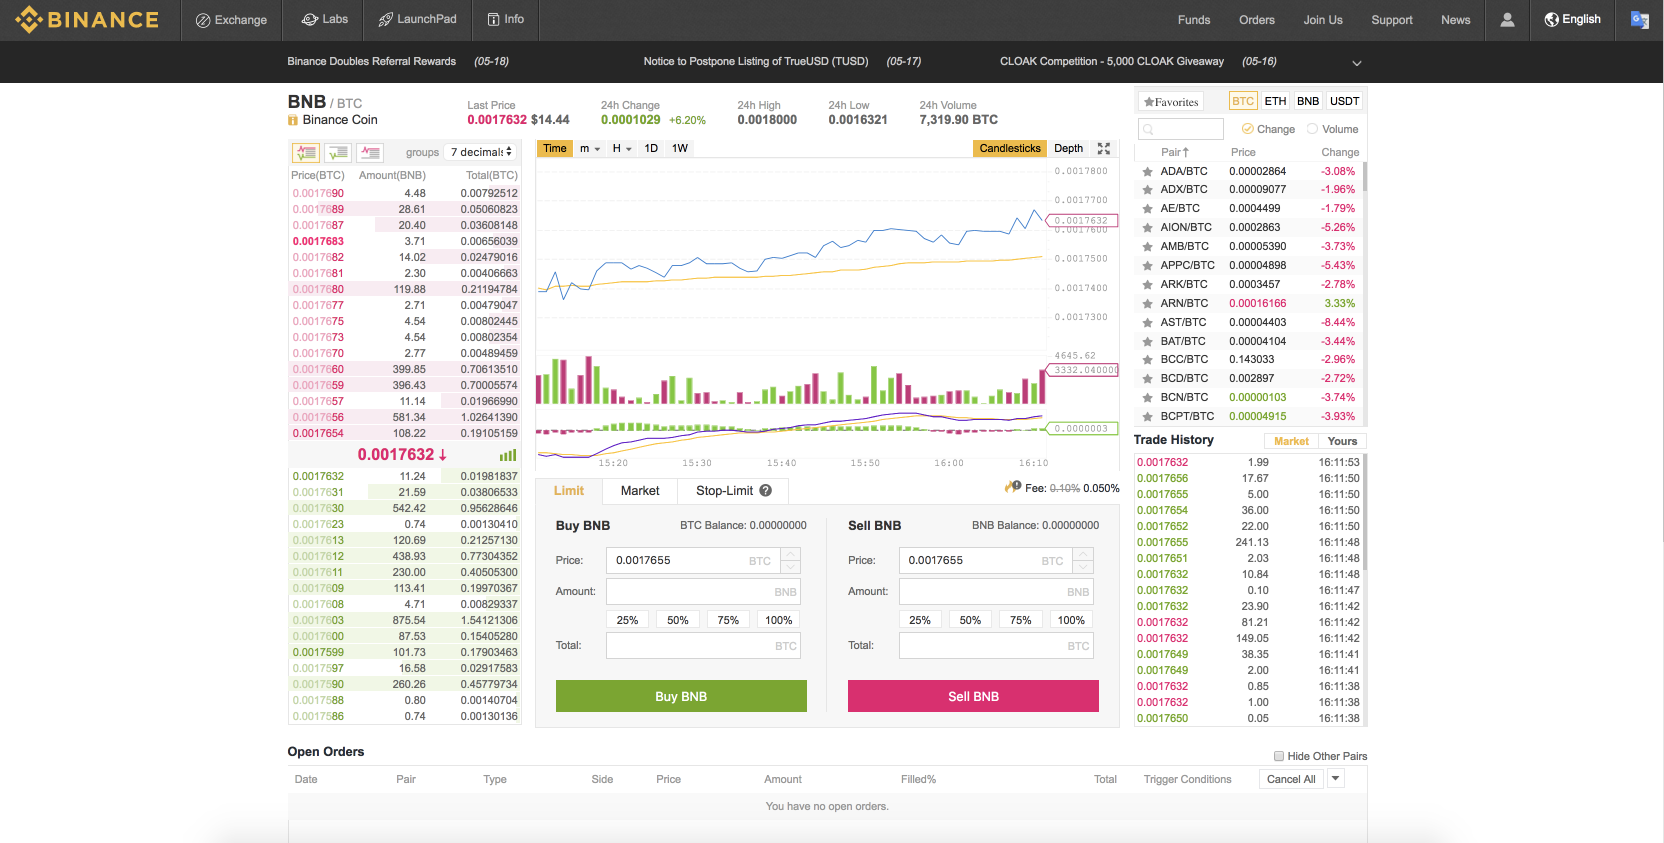
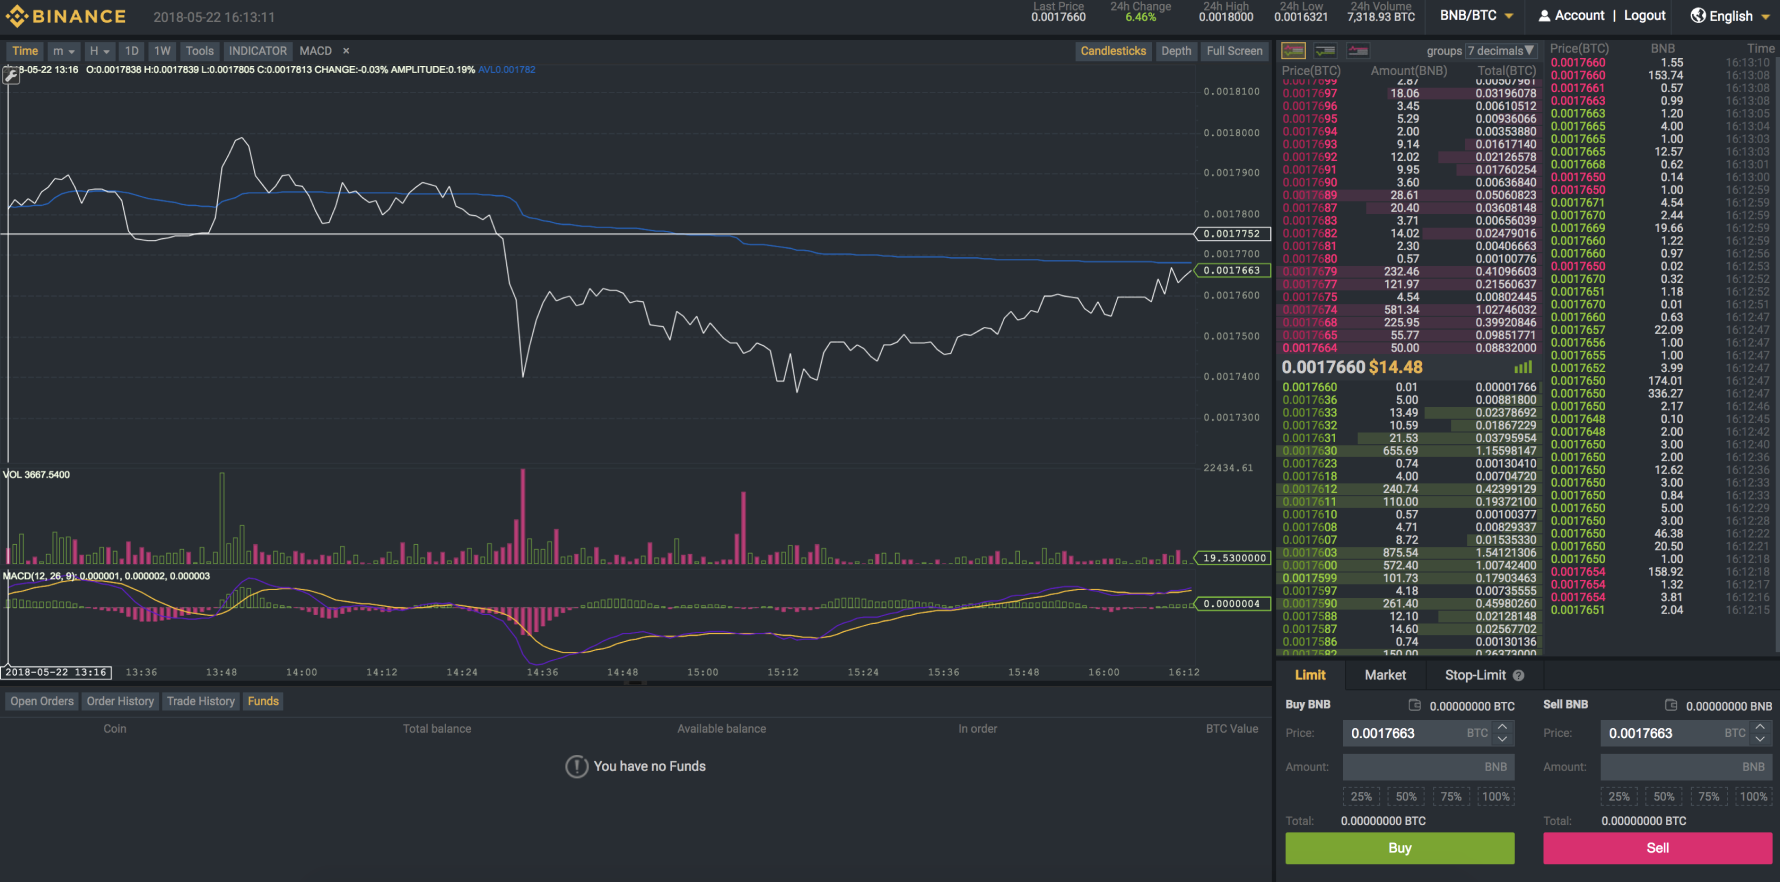
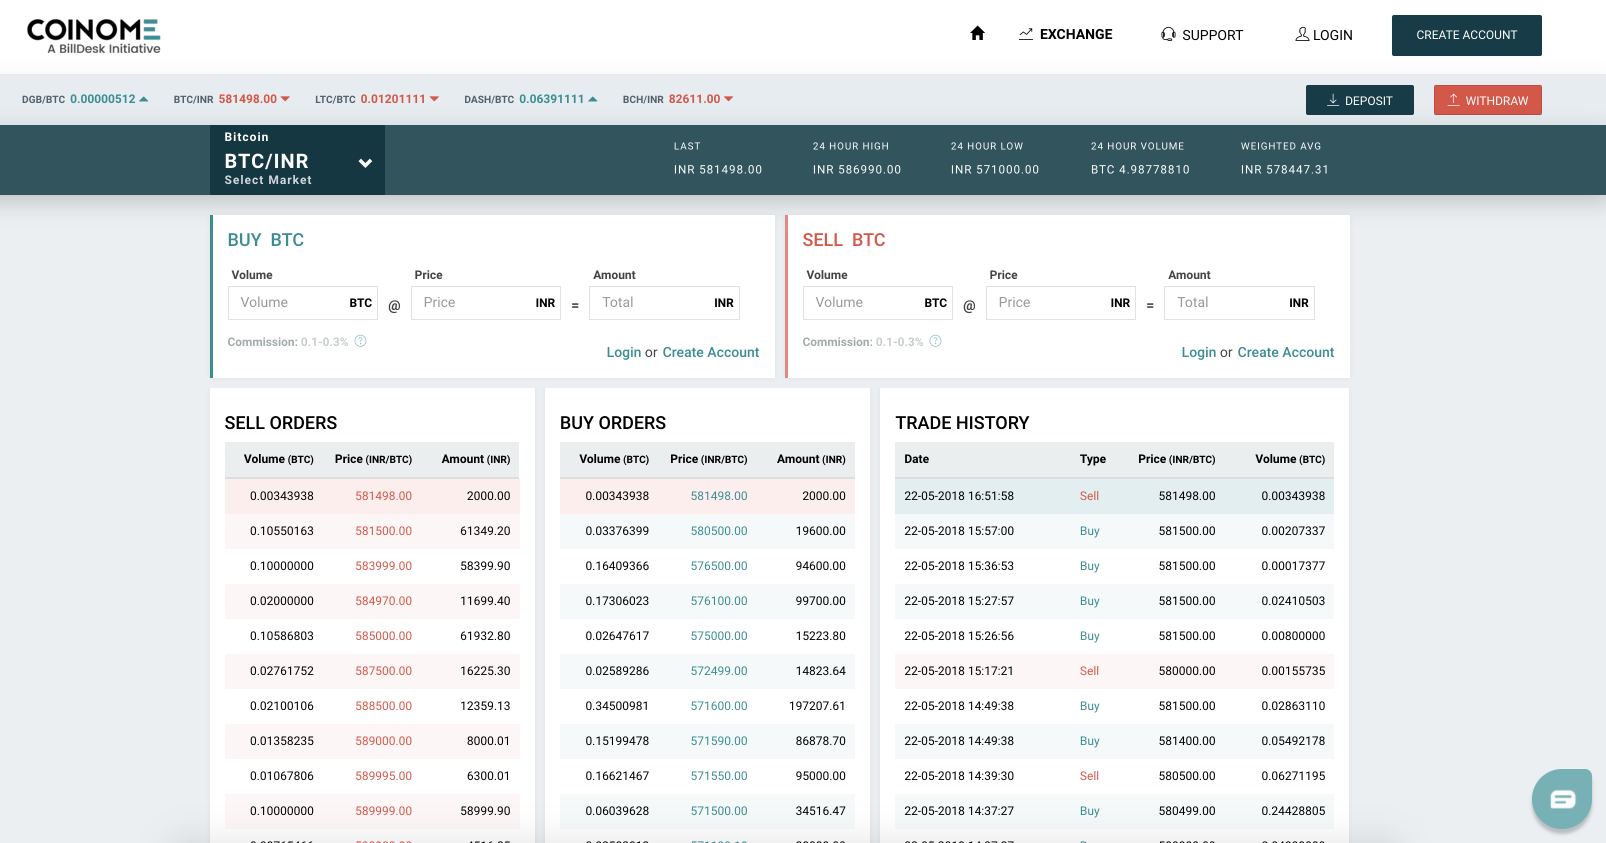
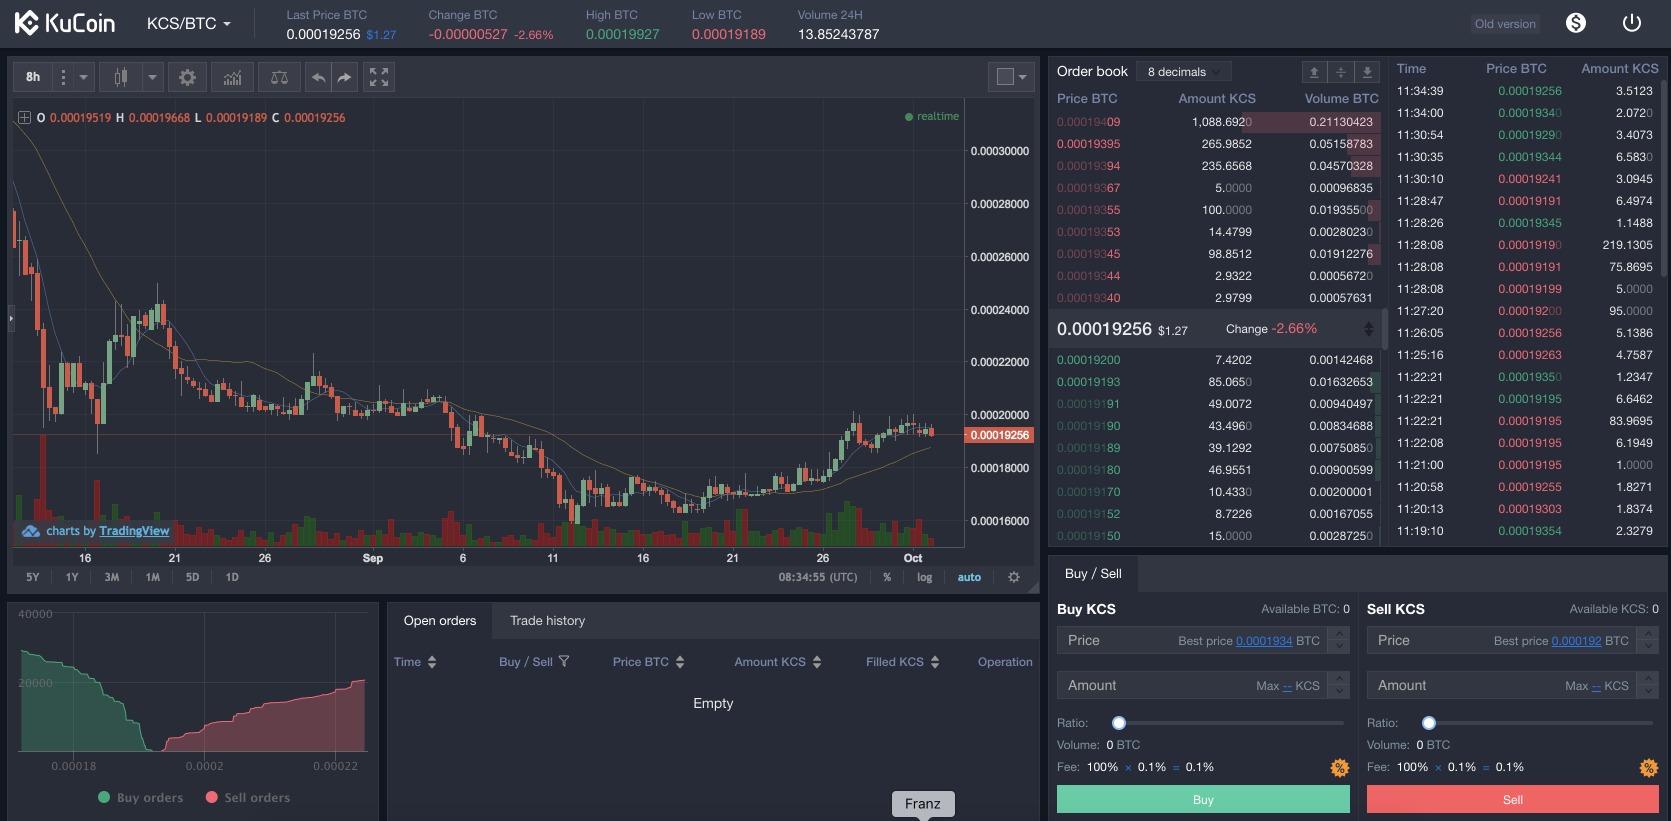
💡 My analysis showed me there are two main types of crypto wallets.
- Platforms for advanced traders, which have a complex layout showing more in-depth information for the specific coin and its fluctuations.
- Platforms like Coinbase, which have very clean and intuitive layout and are more suited to mid-level traders, who don't require and understand very detailed information, but only care about the basics.
It also helped me understand how cryptocurrencies work, how the elements in those products are placed, what's important and how others handle specific problems or at least speculate and assume as to how and why they did what they did.
Phase 1 Mockups
At that time we didn't know who would use our services and what type of trader they would be so we had to place the needle in between advanced and average, 'tutorials' or 'tips' were set up around the product to help with useful information and guide the users through the product and its capabilities.
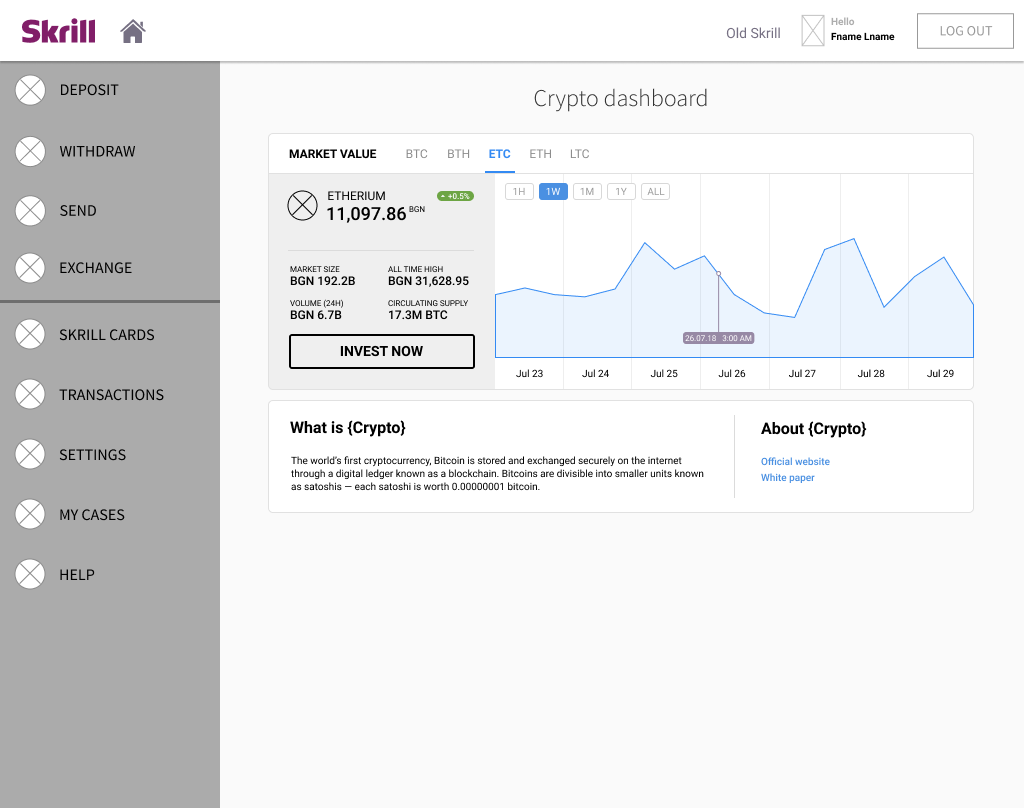
💡 The first version of the Crypto Dashboard offered 4-5 cryptocurrencies and didn't have a lot of options besides investing in the available coins and setting up price alerts.
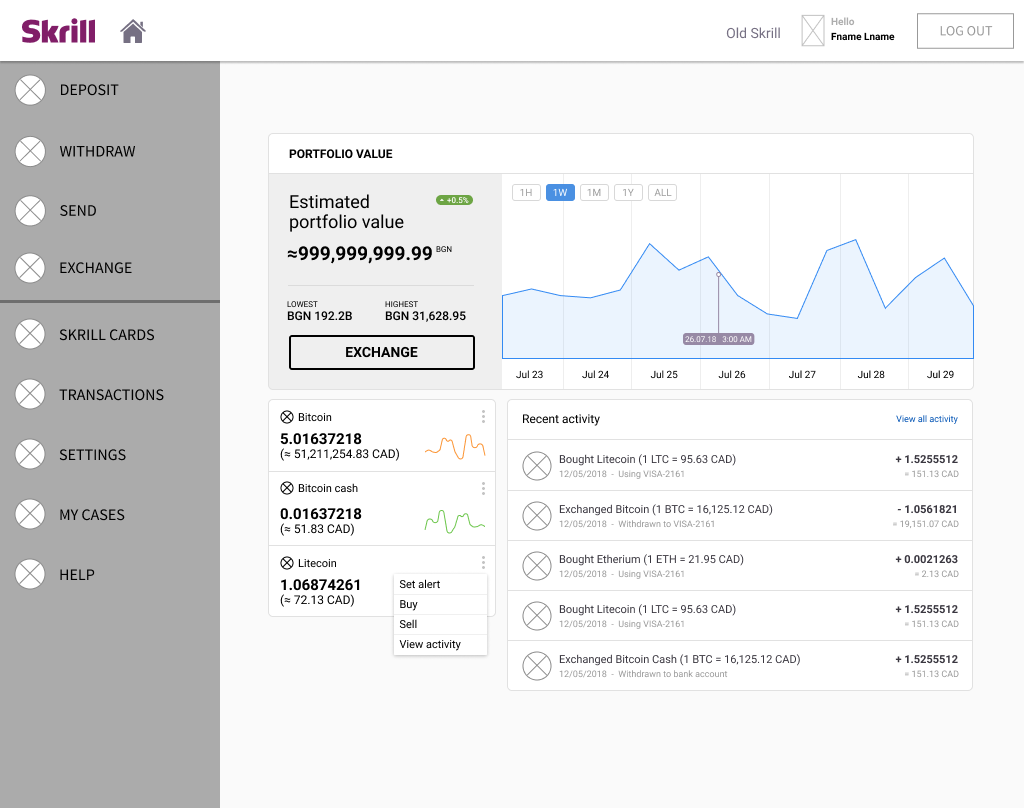
💡 After the user's first crypto investment, the page changed to show a chart visualizing their portfolio value over time.
Below the chart there was a list of the crypto currencies the user invested in and a transaction history widget, displaying their 5 most recent crypto transactions, with a link to the the Transactions page for complete history.
Behavior Analysis
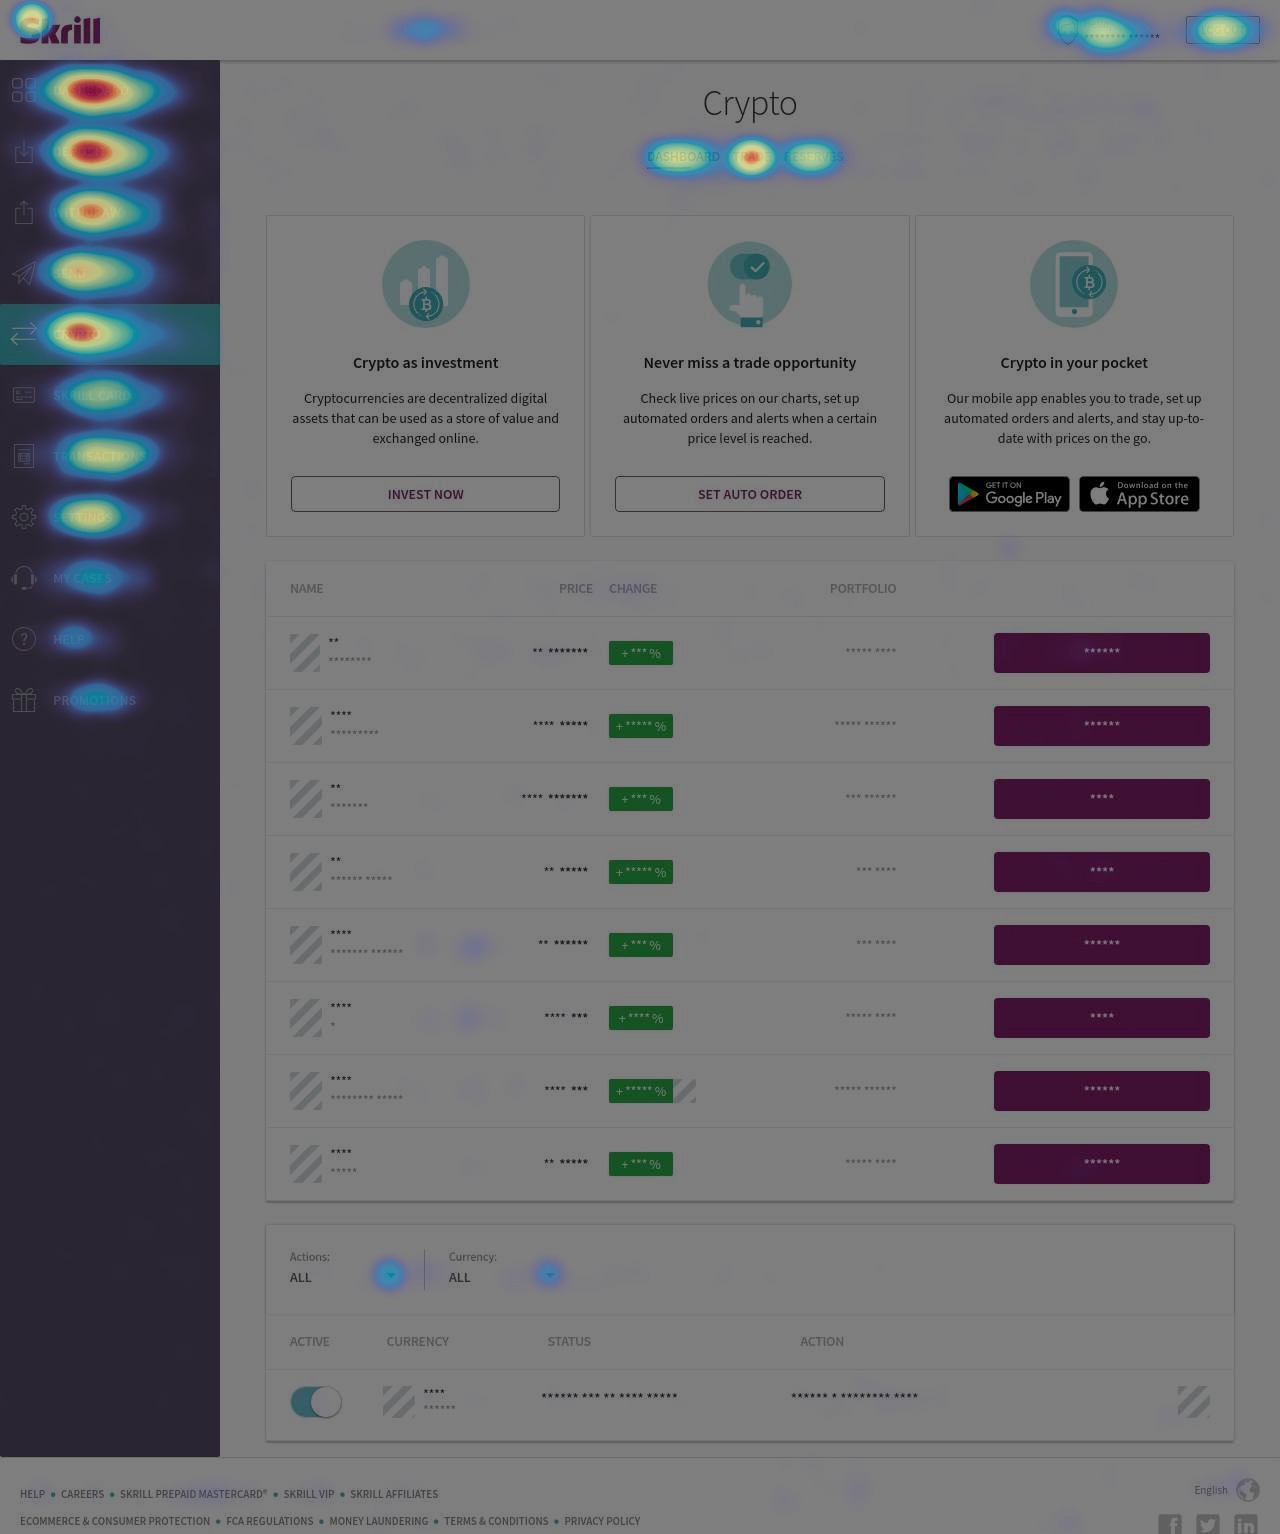
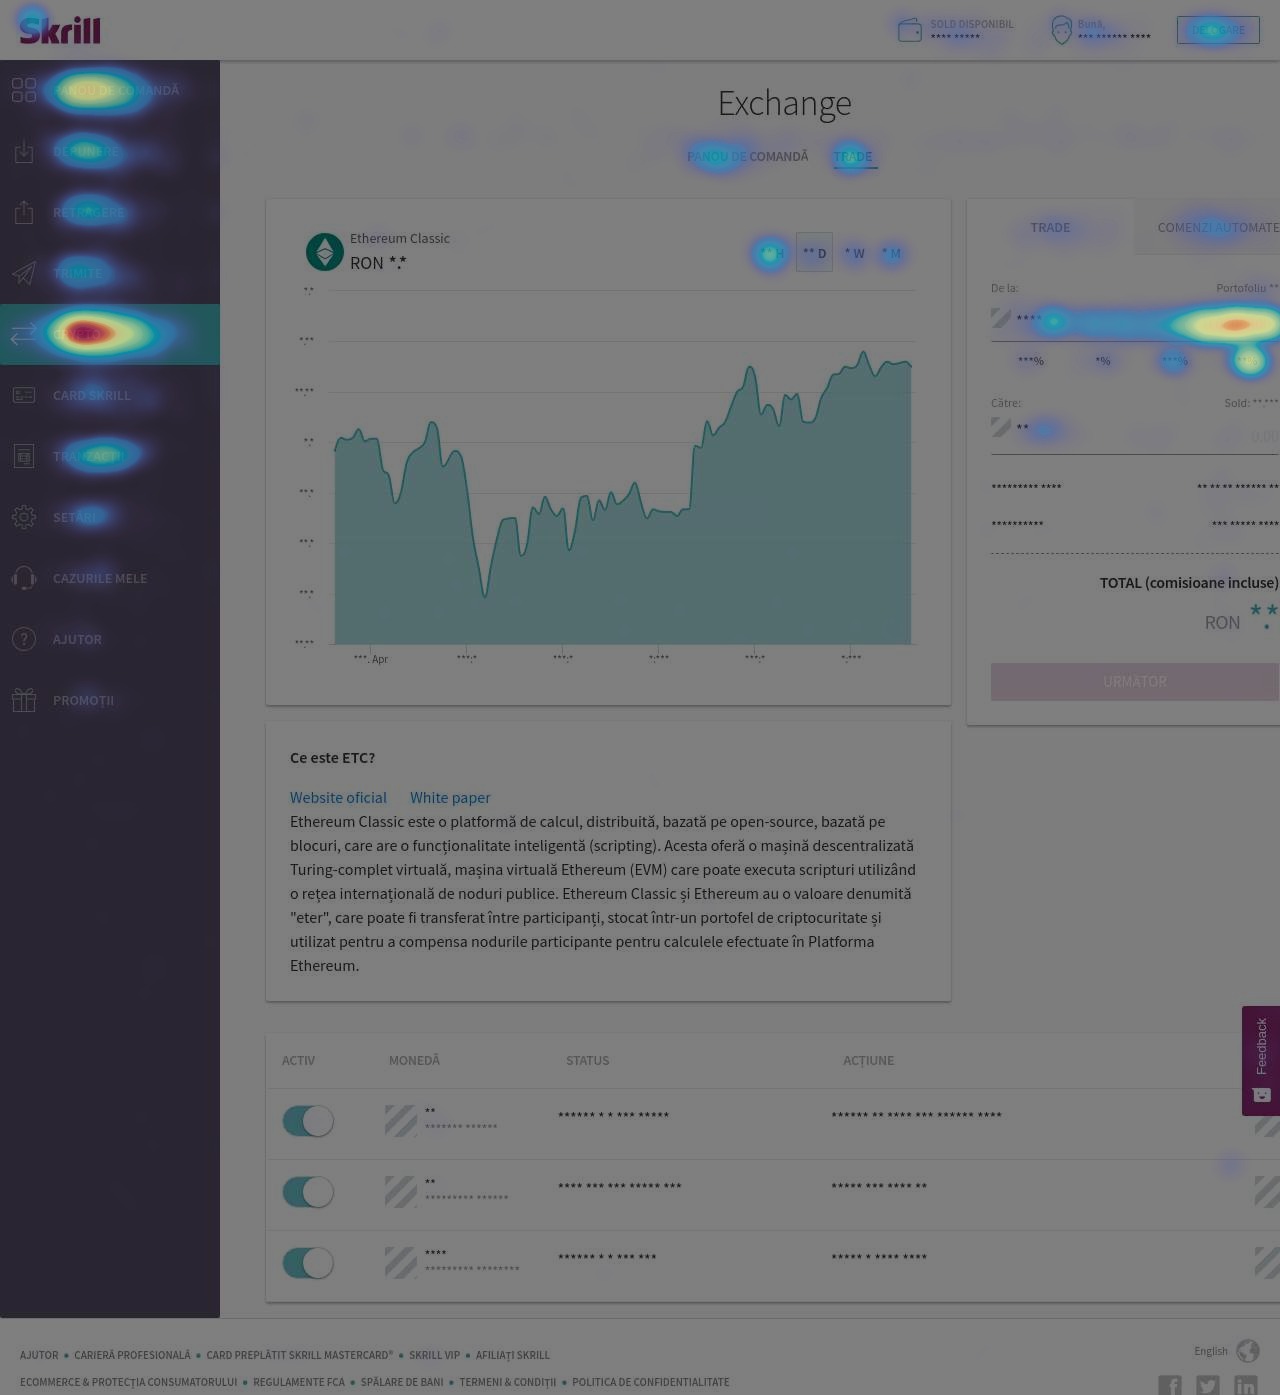
After releasing the initial version of the Crypto Dashboard in late 2018, I set up heatmaps and recordings using Hotjar to try to understand how people interact with the product and see where it needs improvements.
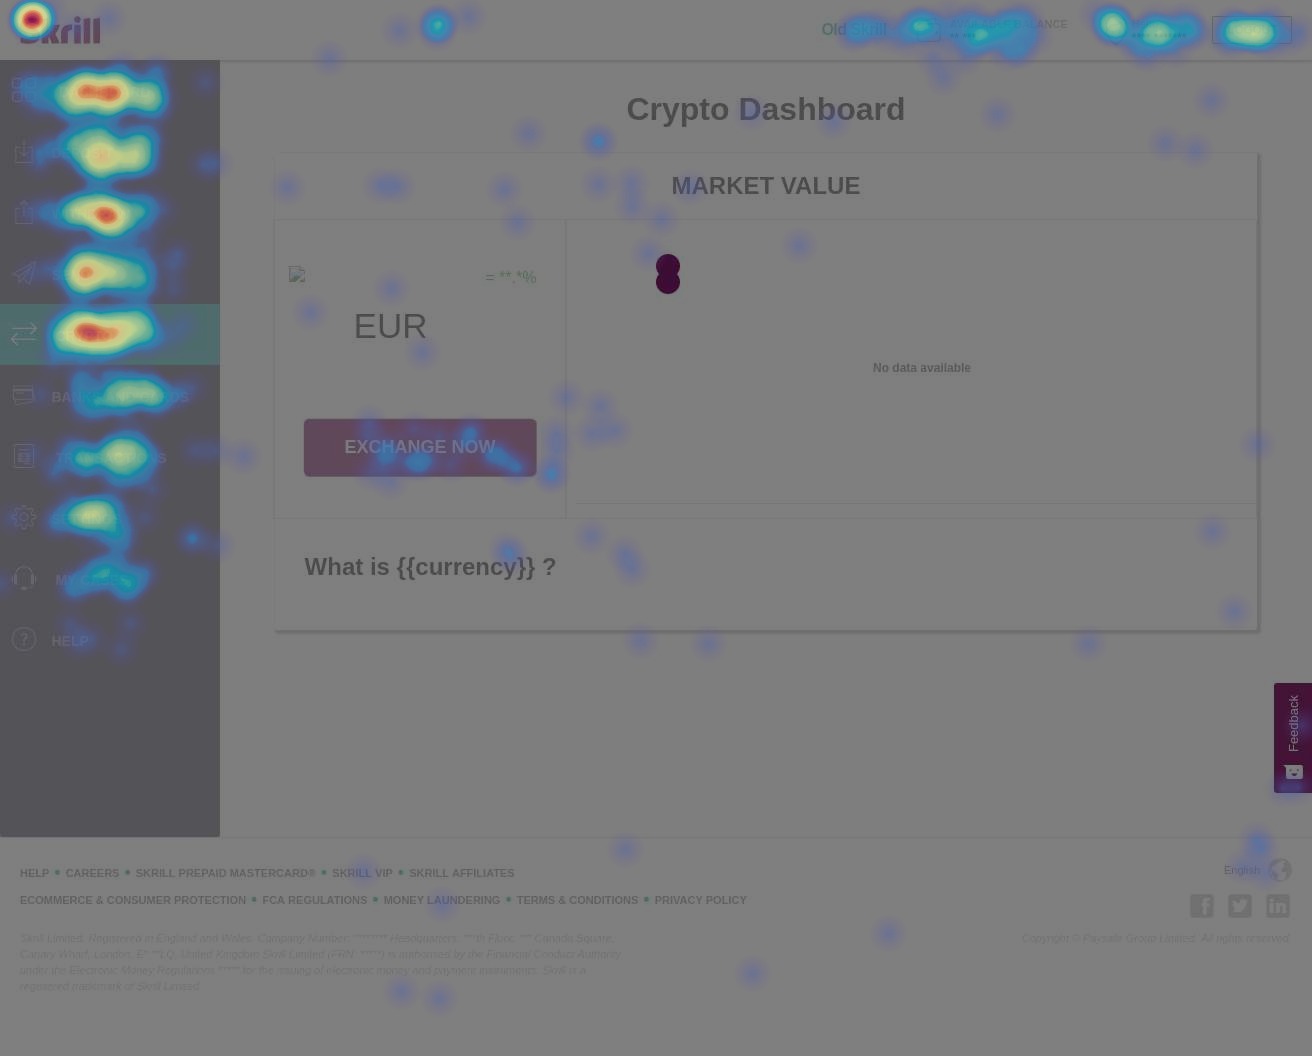
Clicks
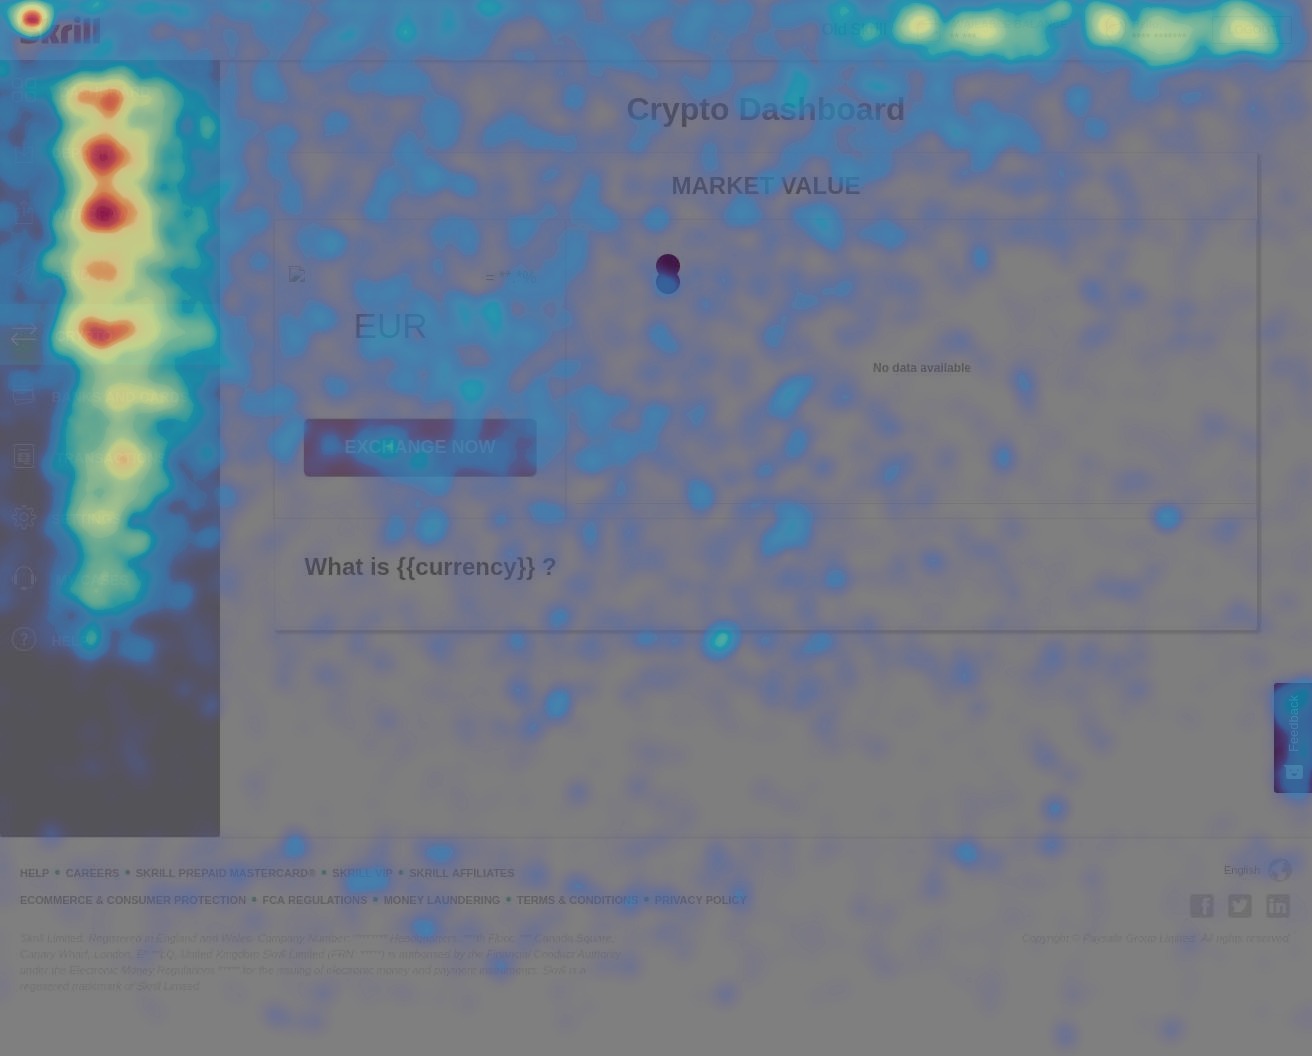
Mouse movement
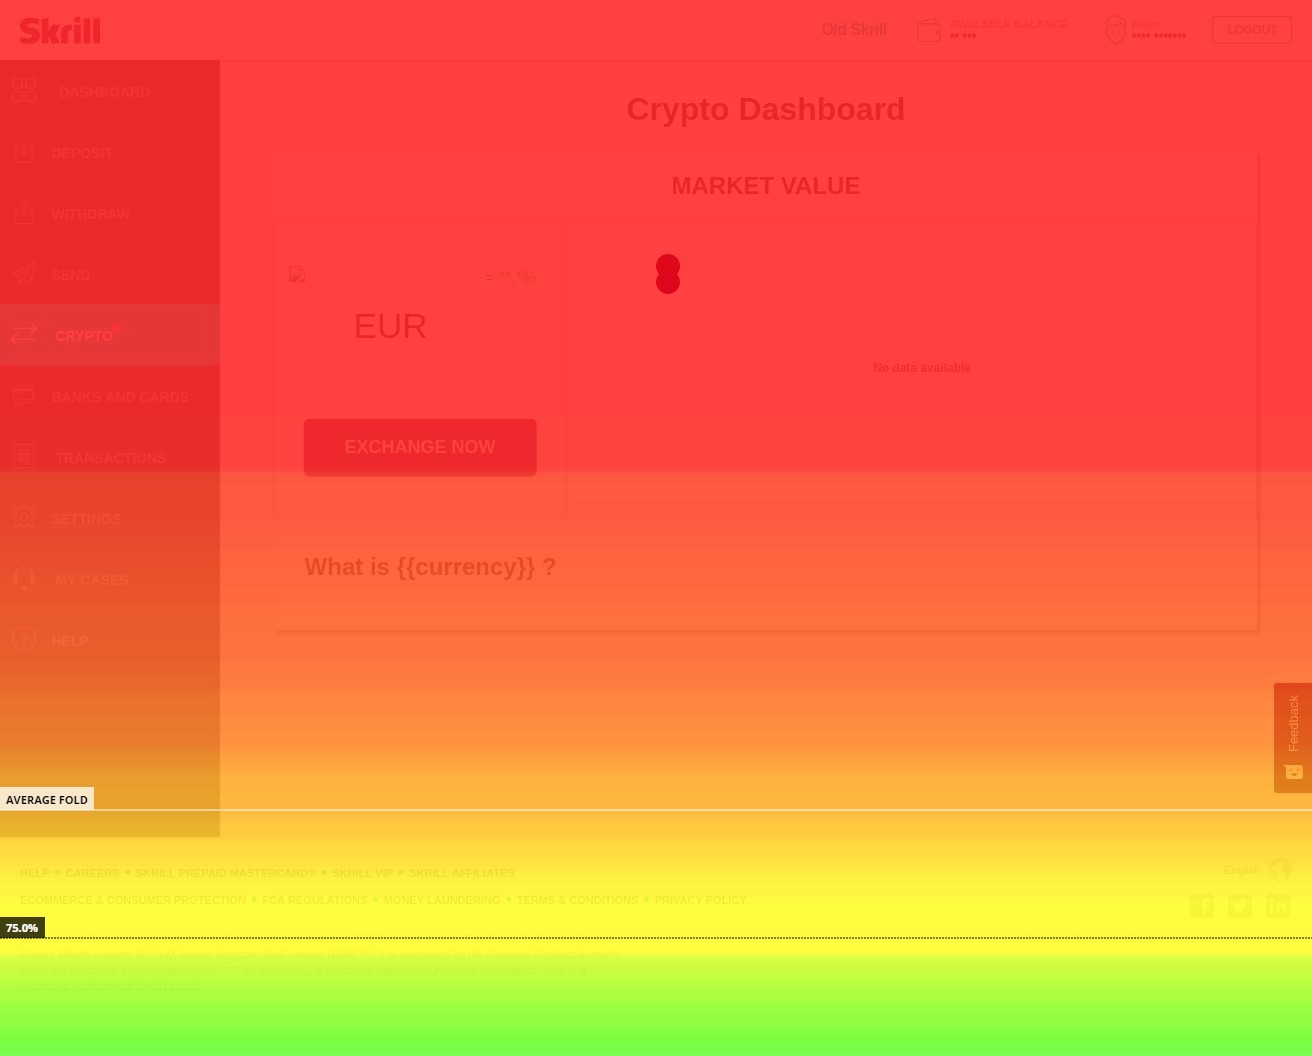
Mouse scroll
💡 My findings at that time were that people didn't really understand how to take advantage of cryptocurrencies and were mostly average-level traders looking to invest in coins every so often.
Mainly they were checking the prices and using the Exchange calculator to see how much coins they could get for their money.
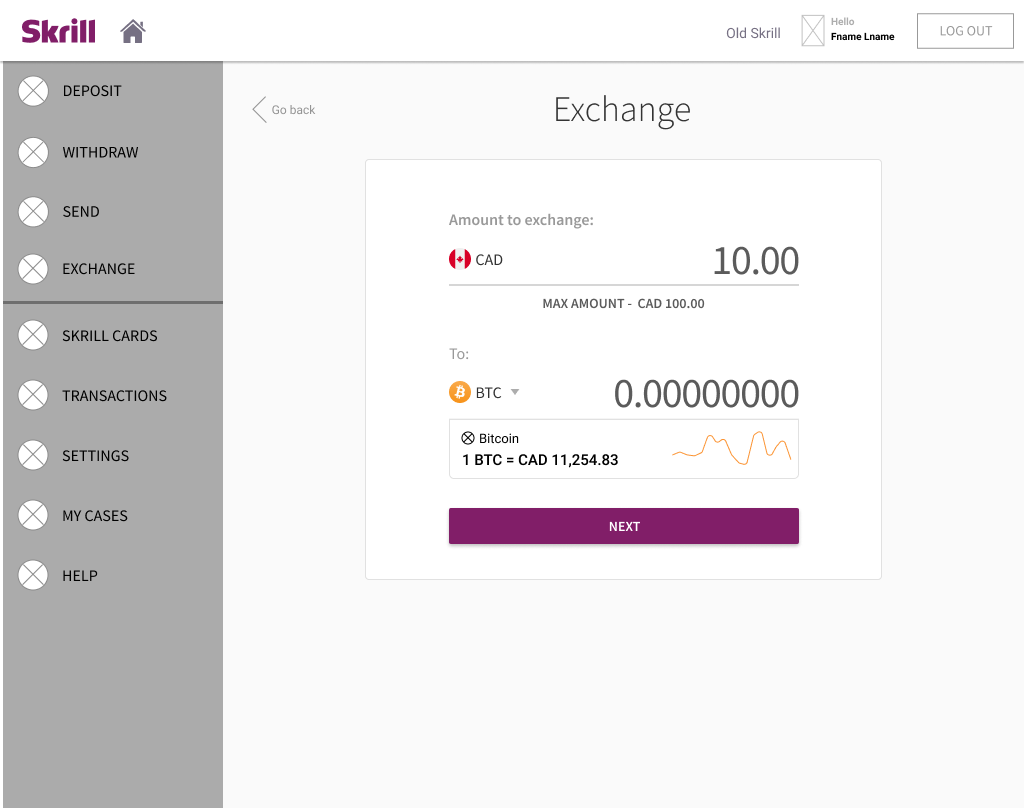
💡 When the user was ready to invest in crypto, they were sent to the Exchange panel where the fields would auto-populate with the desired coin and have a small chart to display the current fluctuation and price of the coin itself.
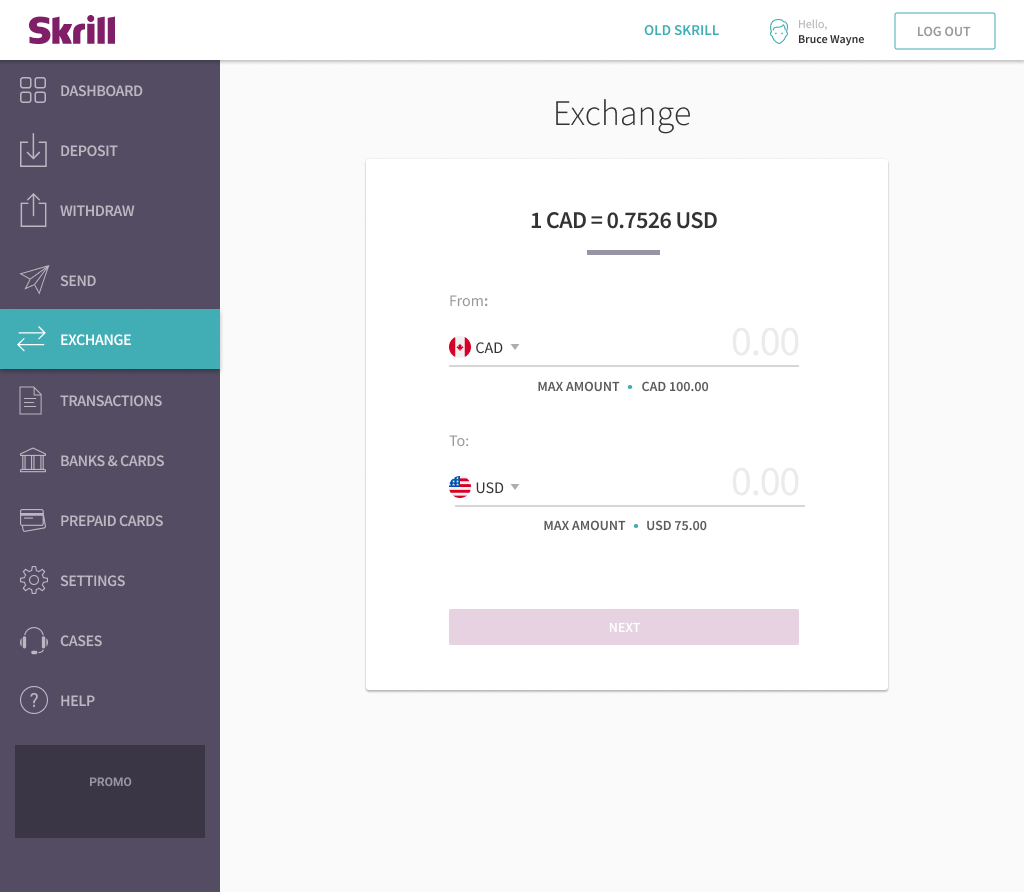
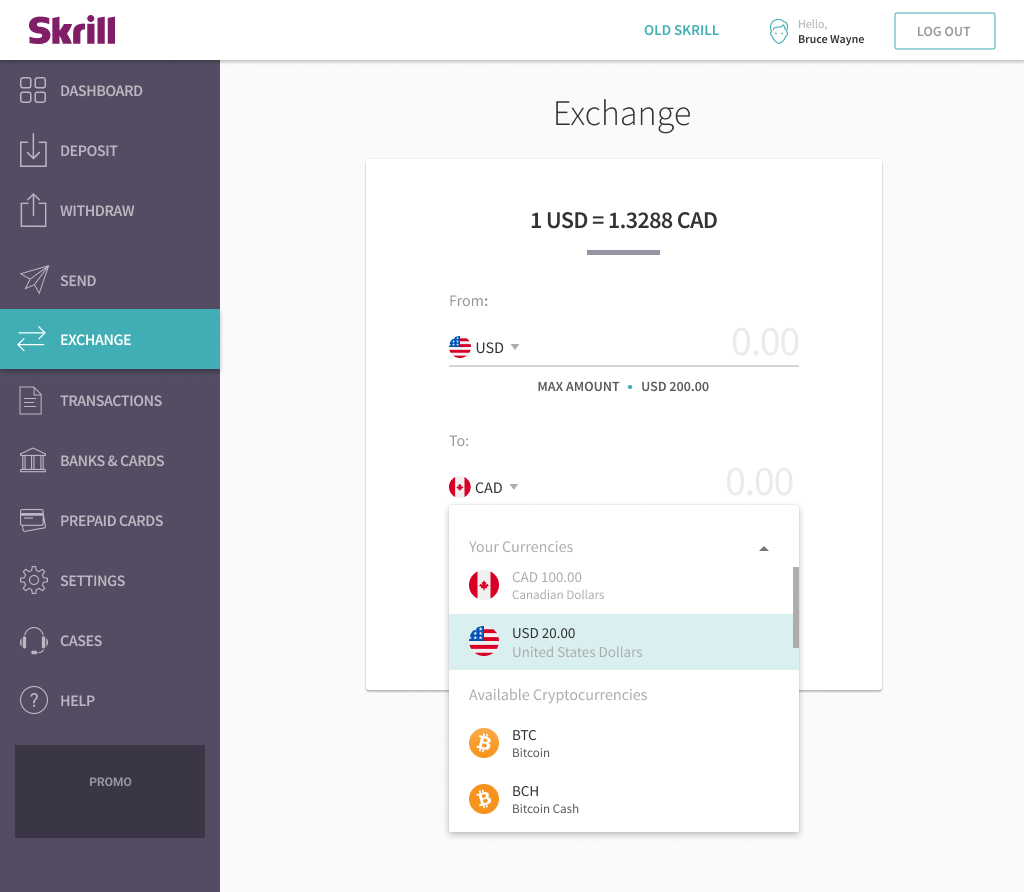
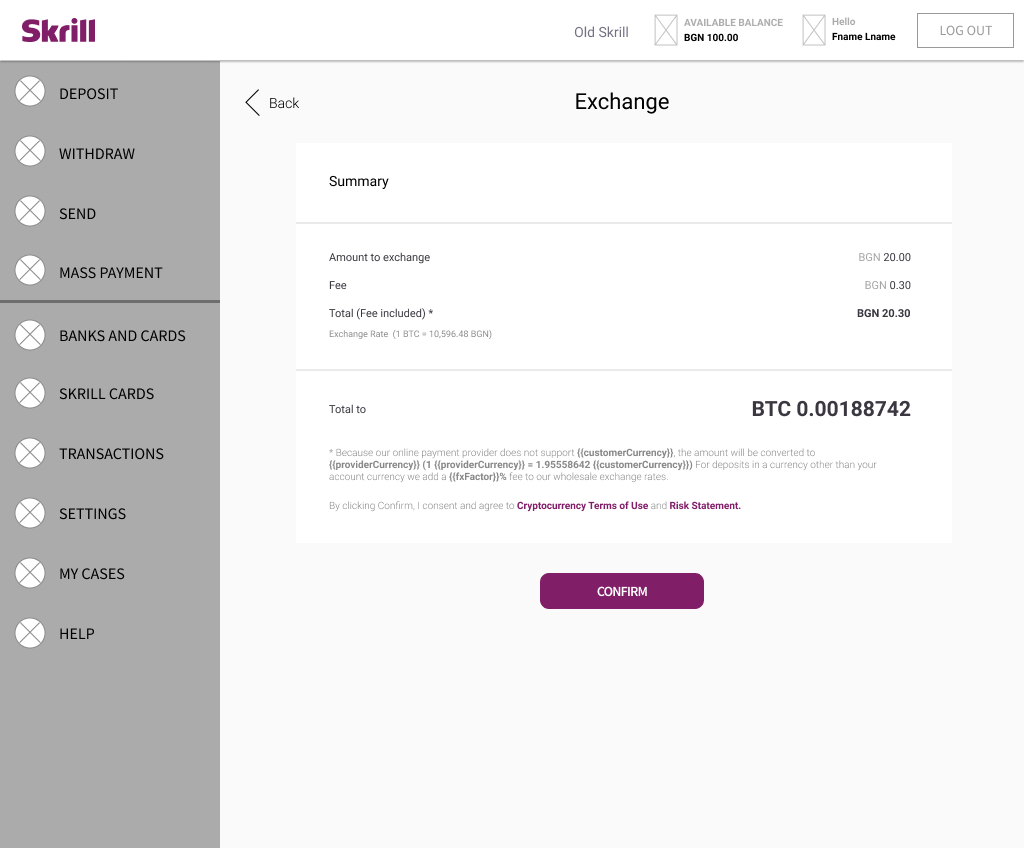
💡 Initially, crypto trading was done on the Exchange page in the wallet.
However, we received feedback from customers and the PO of the project that they didn't like switching context and having to leave the page. To improve their experience, we duplicated the experience to exist inside the Crypto page itself, allowing users to buy crypto coins from there without going back and forth through the wallet.
Ideating and Improvement
In the beginning of the project I was assigned to create a multi-currency flow for Skrill and try to improve what was already there. Taking some patterns from that page I started ideating and trying to implement them inside the Crypto Dashboard.
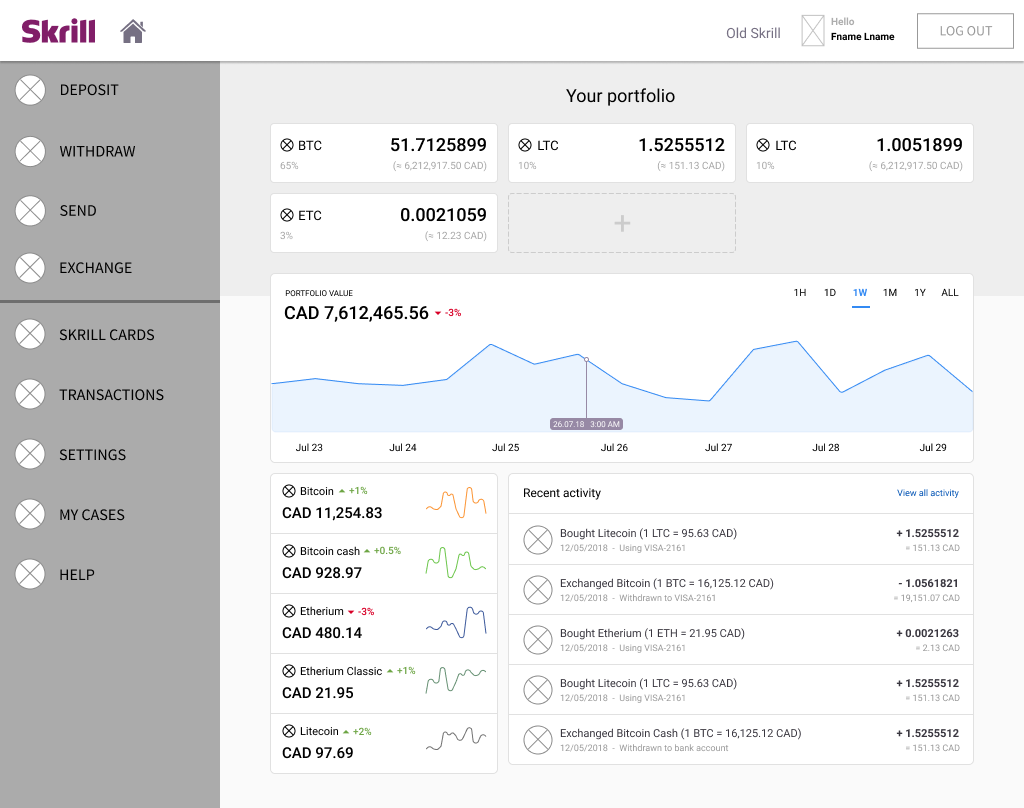
💡 The purchased crypto would appear above the Portfolio Value chart to mimic the Skrill dashboard.
This was short-lived, because the product was becoming bigger by the month and new features were needed that would contradict some of the patterns in the Wallet Dashboard. We got feedback from our users that they want the ability to see how individual coins' price was changing and have a page (or set of pages) where they can still view each coin after investing in multiple crypto currencies.
At that time we only showed individual coins before the user made a purchase. After the first transaction the layout would change so the focus is on the portfolio value and its ups and downs through certain time frame.
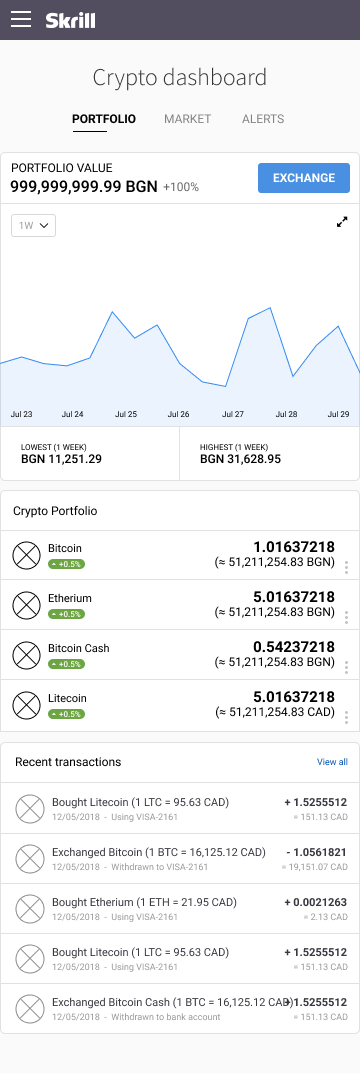
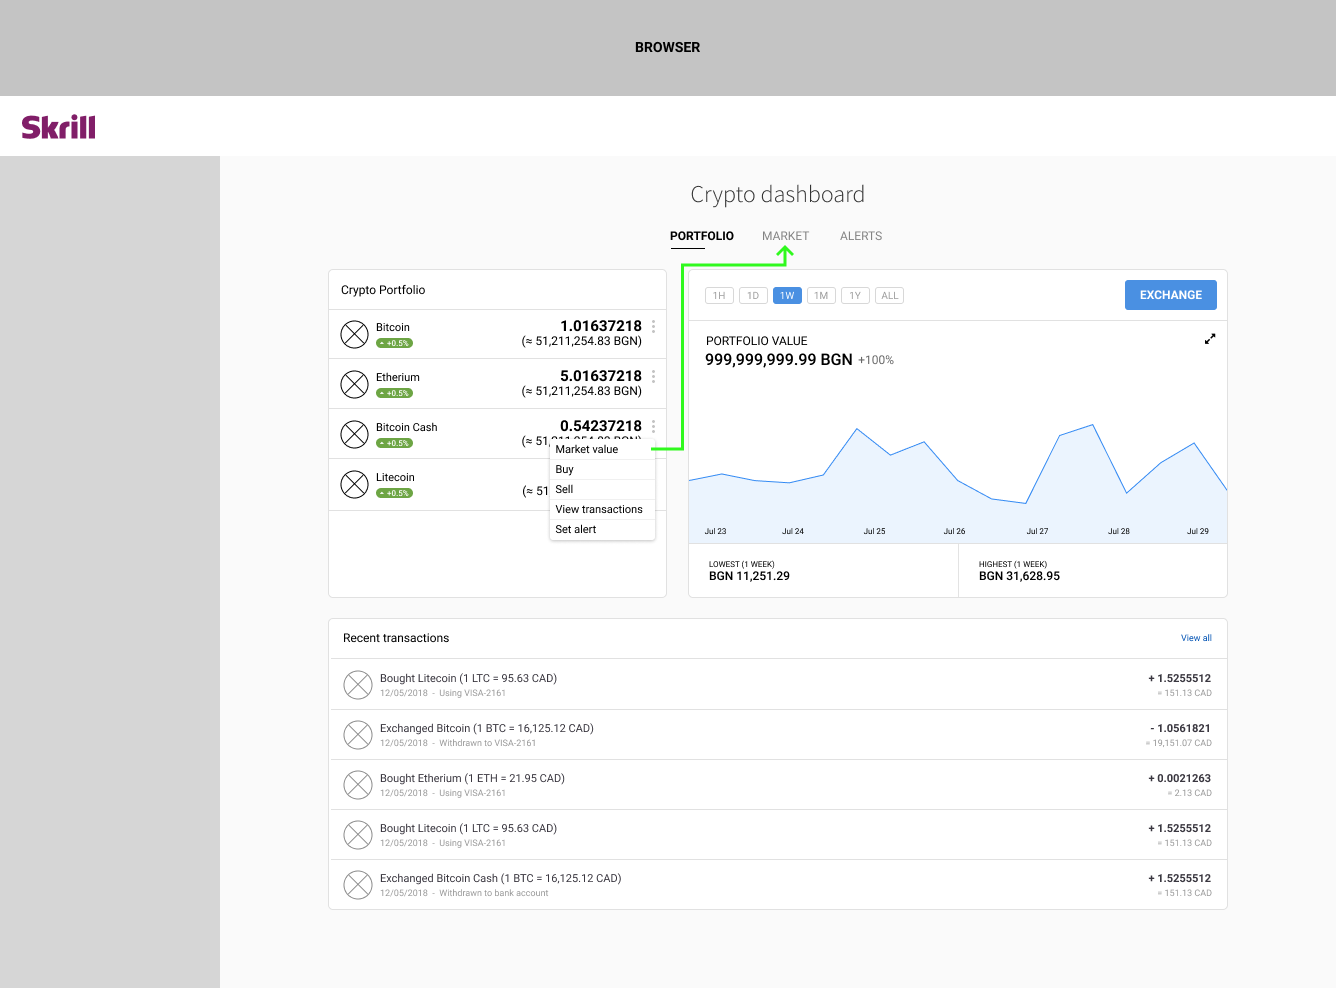
💡 I decided to keep the current view of each coin and add a new tab to the page dedicated to showing information about the crypto portfolio and recent crypto transactions.
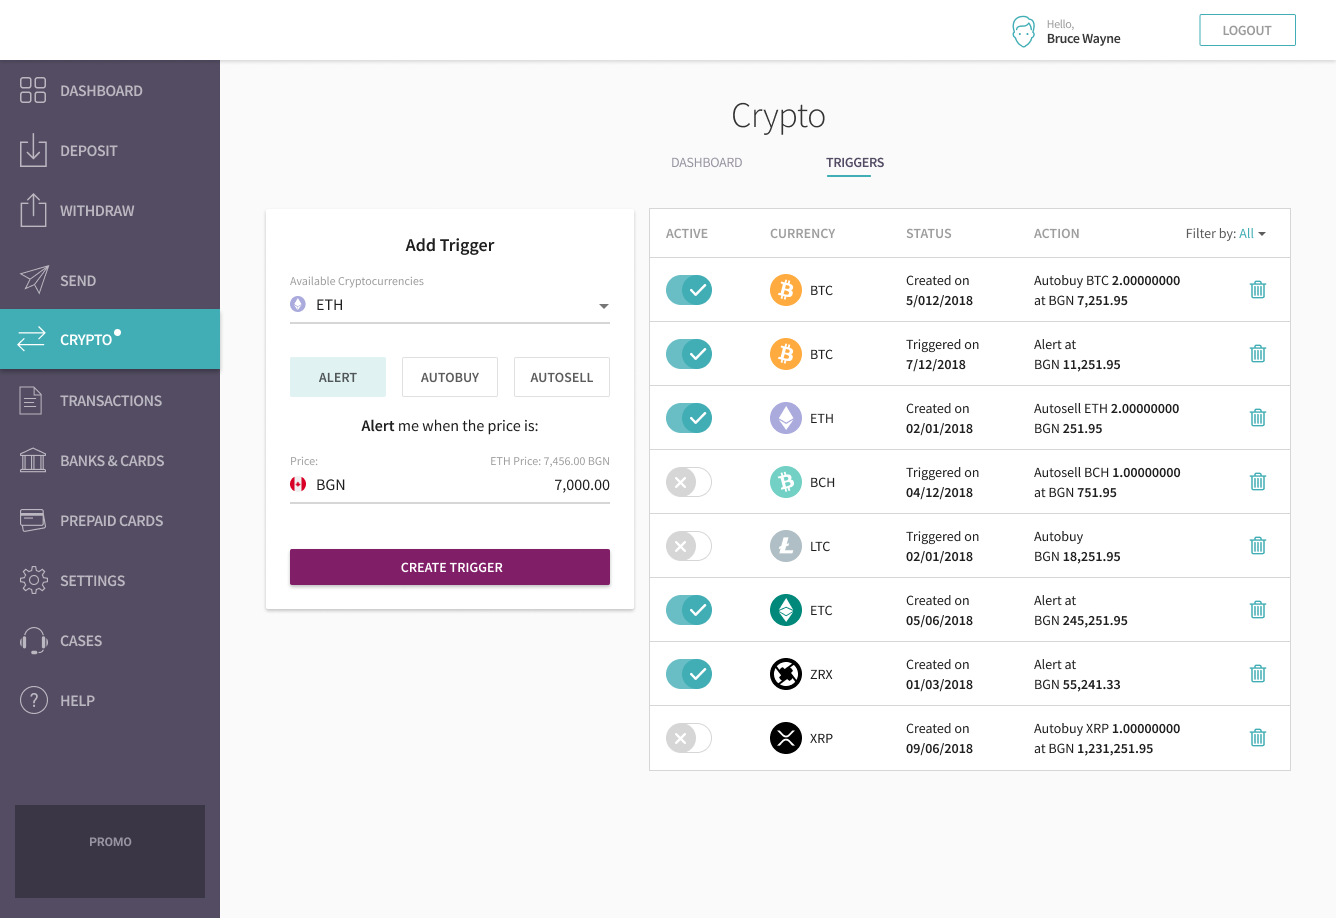
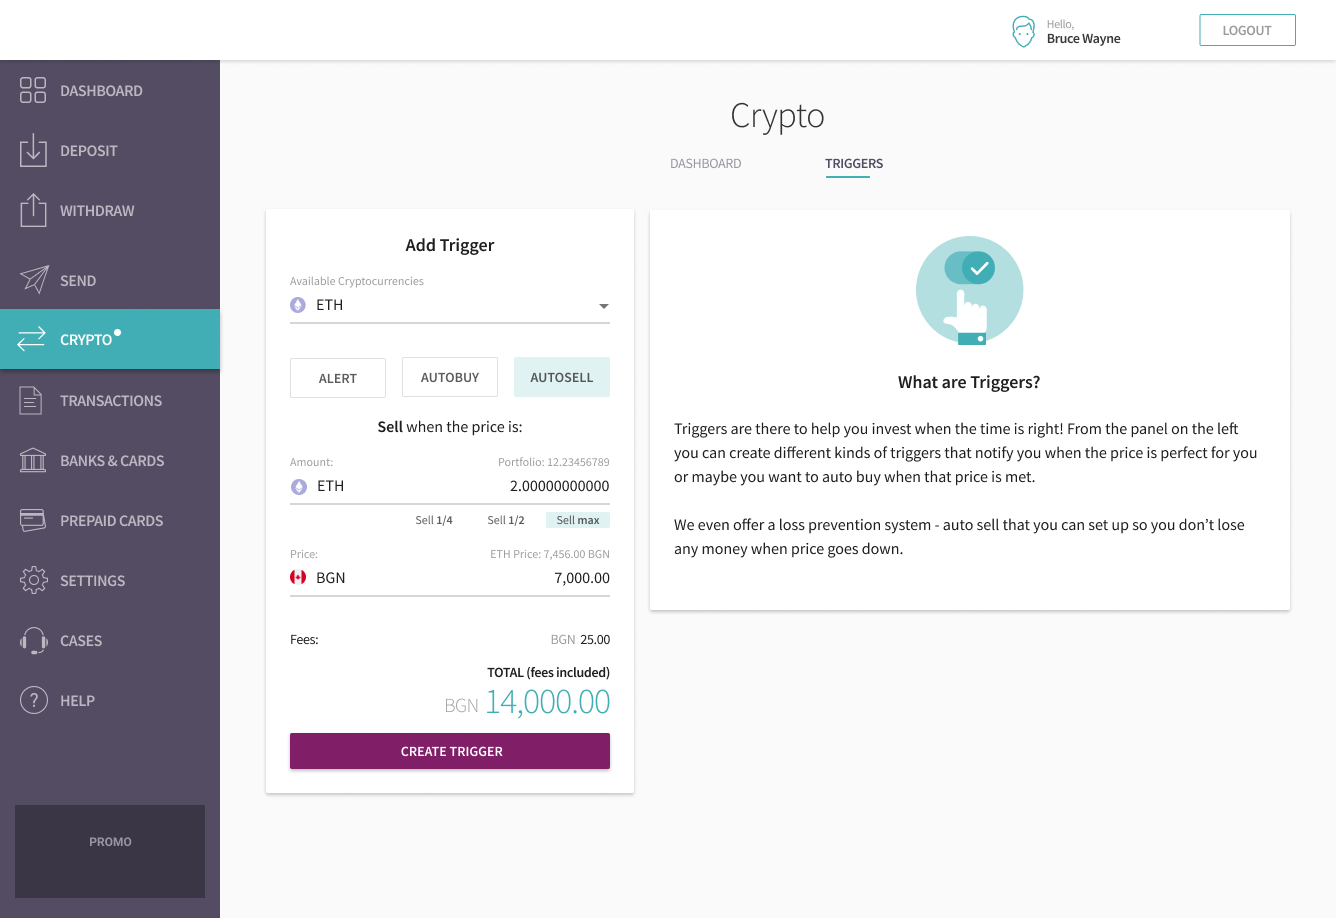
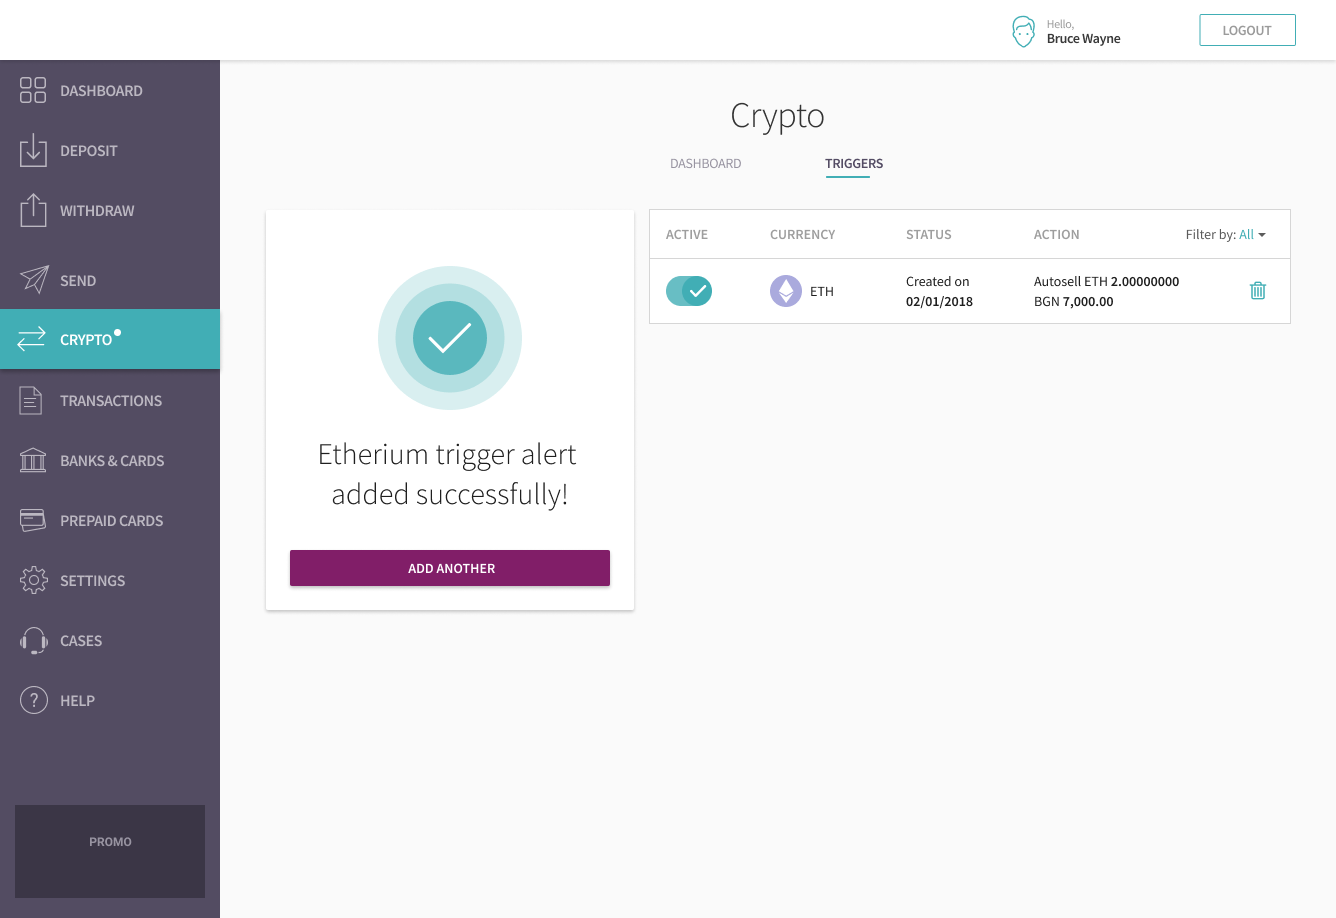
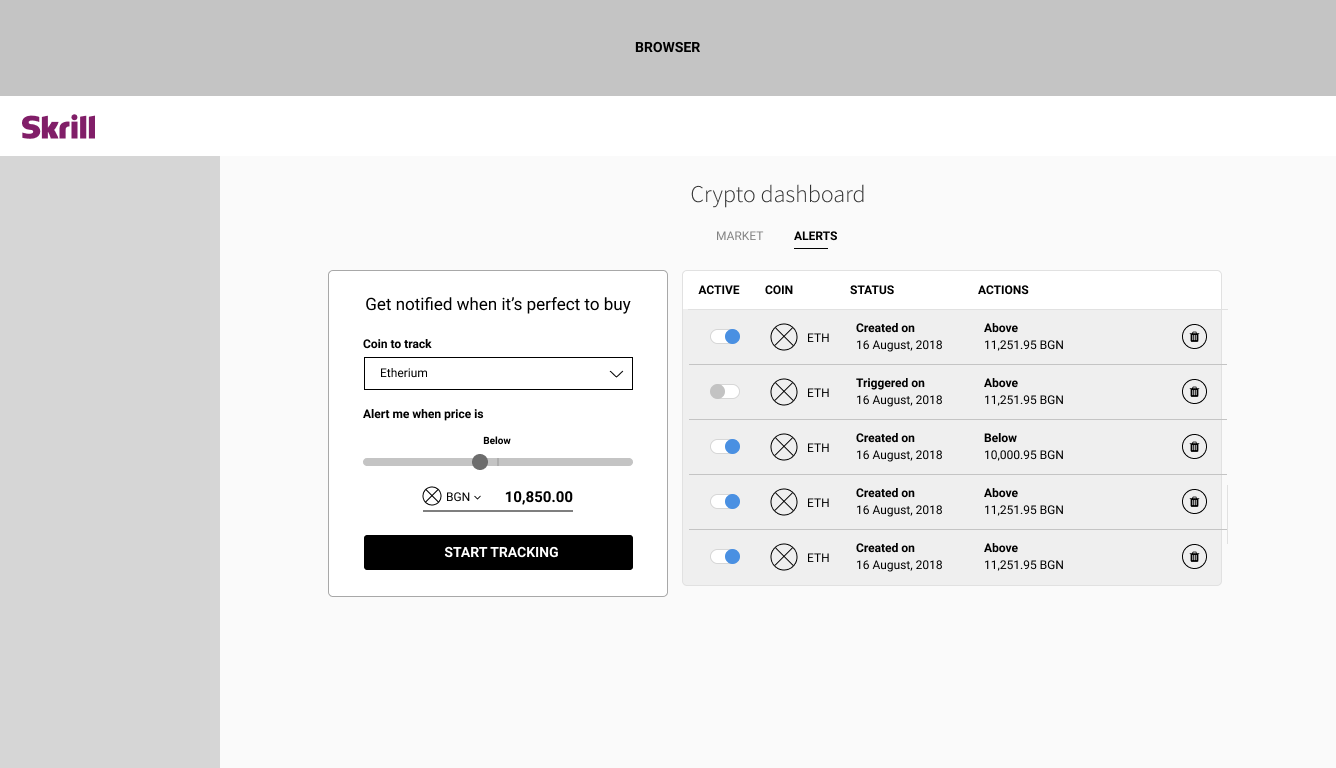
Price alerts also needed a more prominent place and were moved to their own page which allowed users to add, remove and see a list of their current price alerts.
Phase 2 Mockups
With Phase 2 a lot of new features were planned and needed to be displayed properly in the Crypto Dashboard page. Auto Orders were added and merged with Price Alerts and they were moved again to the Dashboard above the Recent Activity. A user could now create a price alert or auto order from the Trade Page and manage them per coin or come to the Dashboard where they could see them all on the same place.
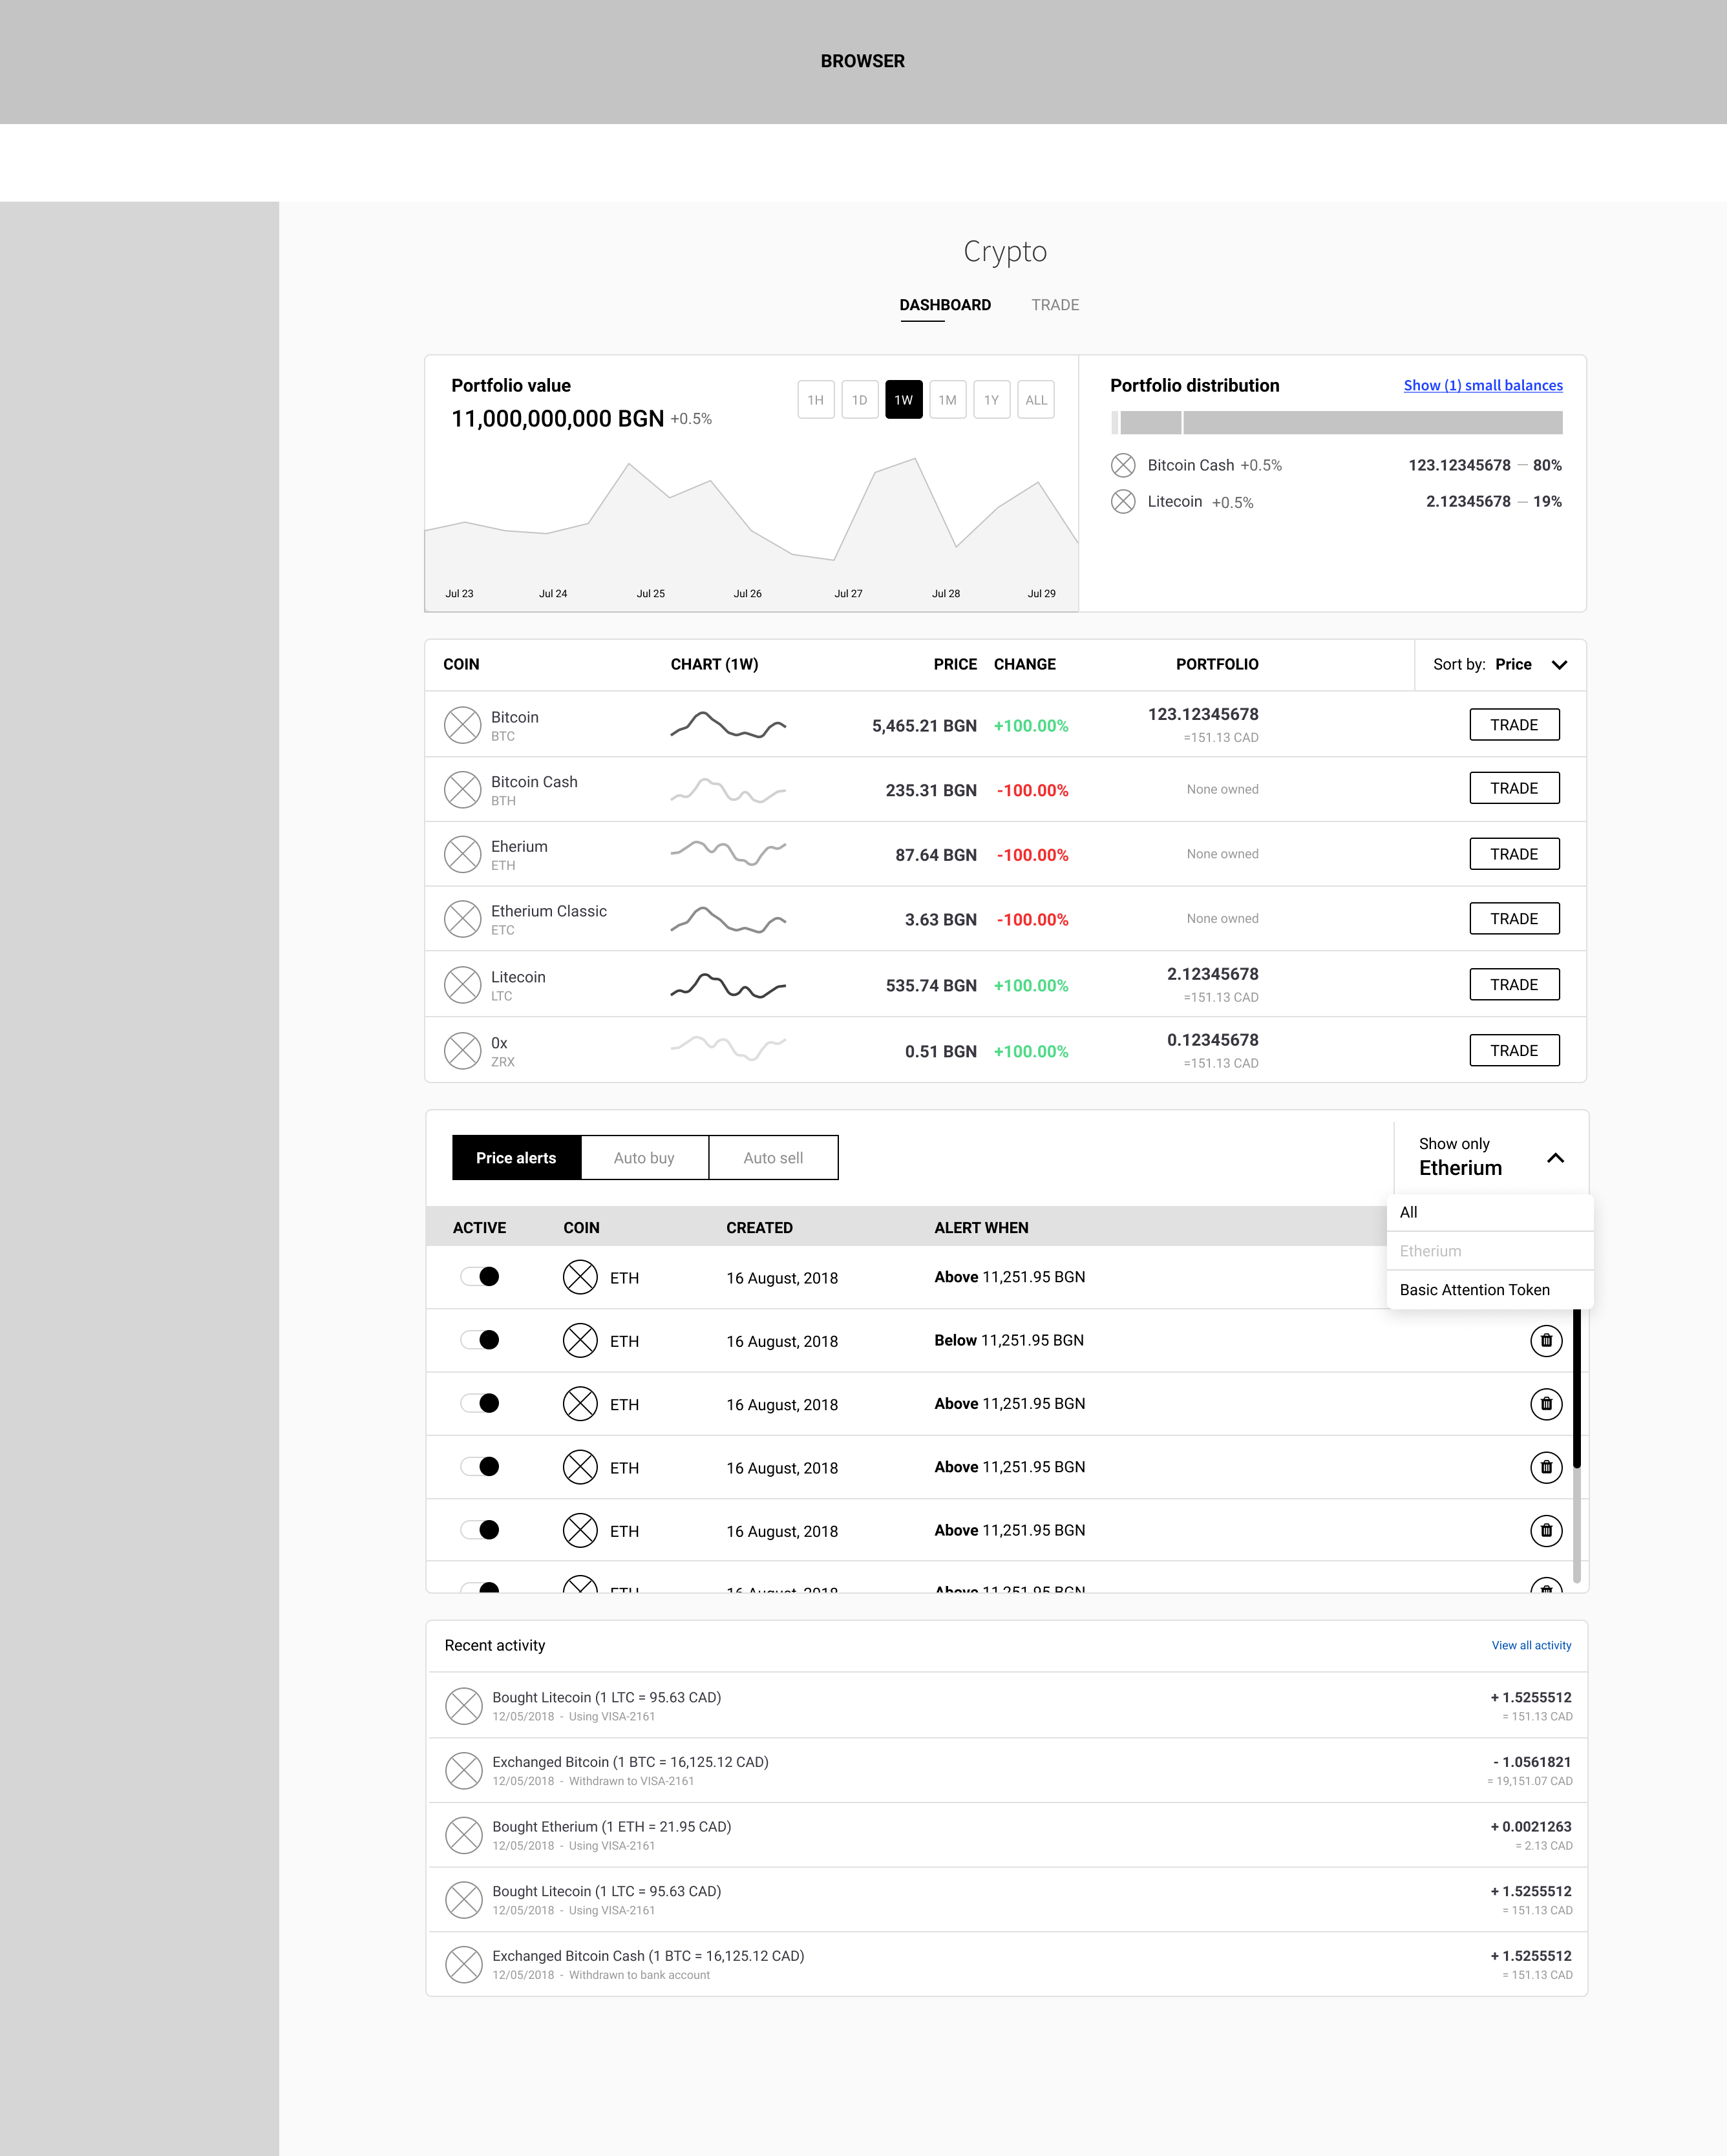
💡 The layout changed a bit to focus more on the graph itself and the purchased coins were moved to the right side of the screen.
The list of the available coins was expanded to fit the full width of the layout and to display more detailed information per coin and how much the user owned.
💡 Before investing in crypto, the graph was hidden and instead a few other cards were shown that advertise crypto itself, auto orders and our mobile app.
User Personas
A short workshop was set up by the company as an initiative to help identify some of our customers and set up User Personas for several wallet segments. The result was an interview with about 15 people for the Cryptocurrency project which helped us create a rough draft of some user personas so that we can base our UX and UI on actual user needs rather than business needs.
Trialist
“I’m new to cryptocurrencies and want to try them out to see what is all the hype about.”
👥 Crypto Customer base: 44%
💸 Crypto revenue: 16%
Pain points
- Can’t withdraw to blockchain wallet
- High fees
Needs
- Support of more cryptocurrencies
- Advanced charting
- Advanced trading
- Tutorials (how to buy/sell, introduction tocryptocurrencies)
Investor
“I’m long-term investor. Active trading is not for me. Need to learn more about cryptocurrencies”
👥 Crypto Customer base: 28%
💸 Crypto revenue: 21%
Pain points
- Can’t withdraw to blockchain wallet
- Minimum buy limit is too high
- High fees
Needs
- Support of more cryptocurrencies
- Advanced charting
- Advanced trading
- Spend crypto with prepaid card
- Tutorials or Tips (how to invest better)
Trader
“I trade various financial assets on a daily bases. I use different platforms, and want to freely move money between them”
👥 Crypto Customer base: 27%
💸 Crypto revenue: 62%
Pain points
- Can’t withdraw to blockchain wallet
- Minimum buy limit is too high
- High fees
Needs
- Support of more cryptocurrencies
- Advanced charting
- Advanced trading
- Spend crypto with prepaid card
- Tutorials or Tips (how to invest better)
- Real-time trading
The Product Now
A little bit more than a year has passed since I started working on this project and it's been quite the journey. The product has been steadily increasing in revenue and thousands of users visit it each day, providing us with Hotjar feedback and recordings. Tests and interviews are being conducted and set up to continuously gather information on how to make the product even more user-friendly and boost the revenue.
Dashboard
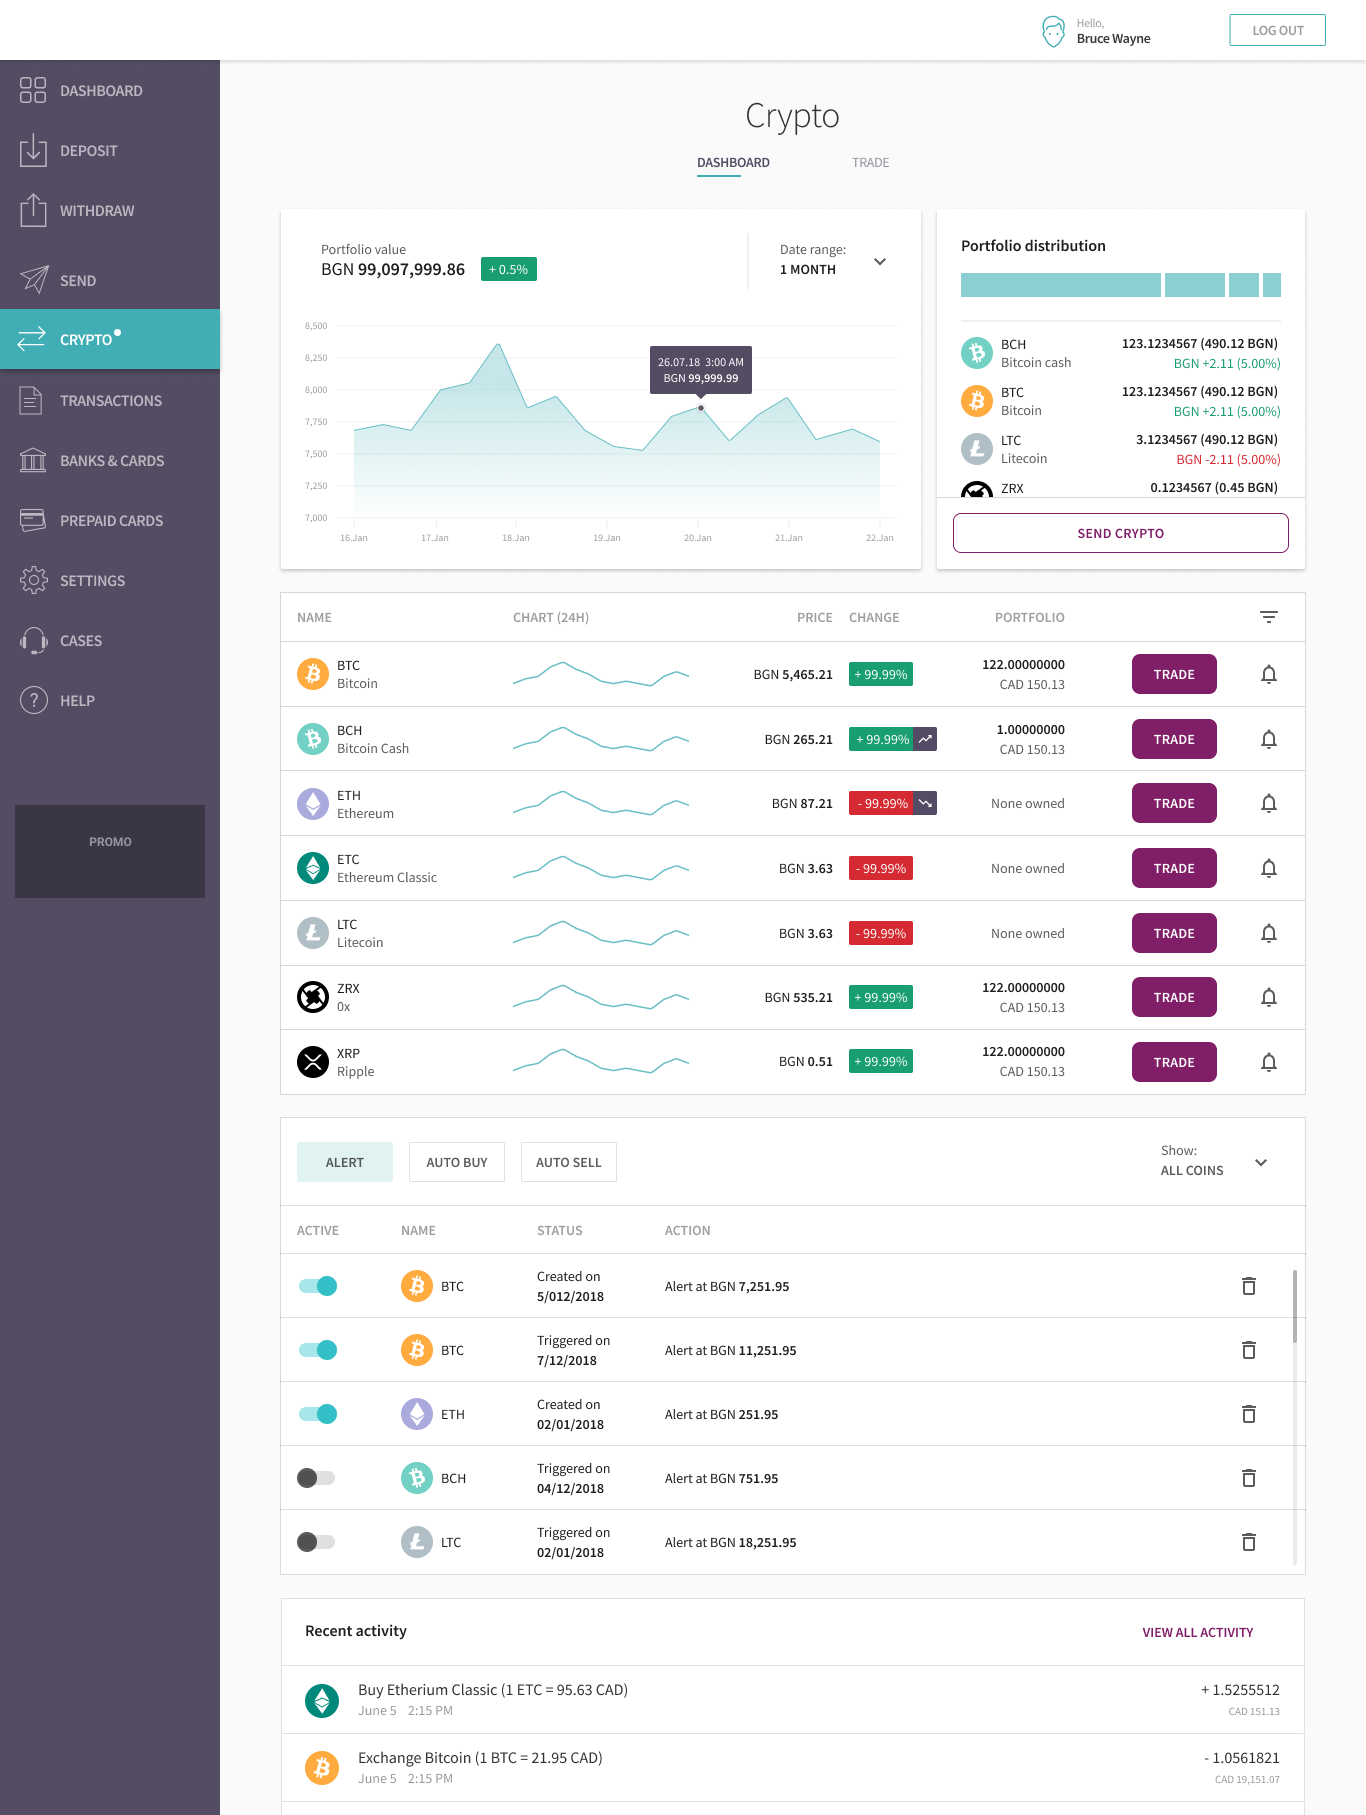
The Dashboard hasn't evolved much from the last iteration, but through user interviews and feedback it has proven itself to be the layout that makes most sense and is more usable compared to older versions.
Trade Page
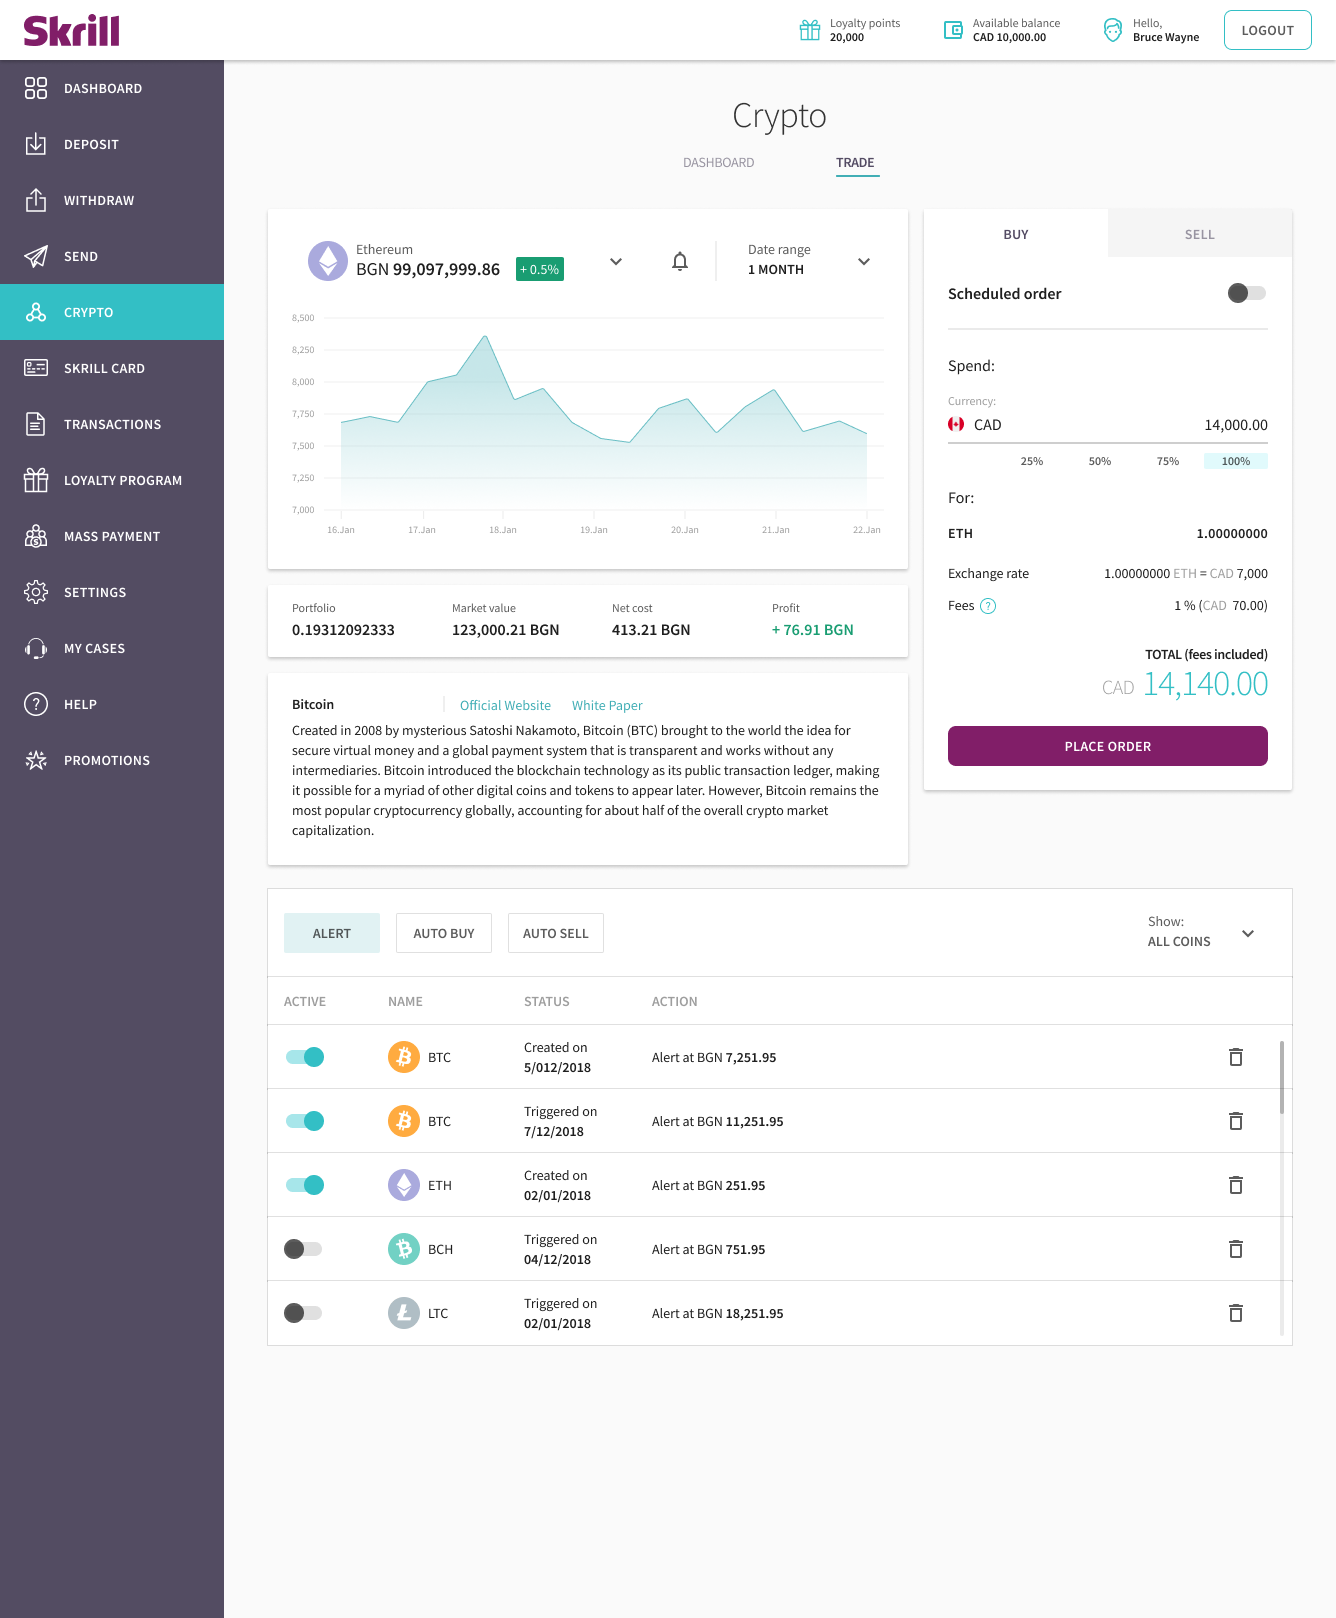
The Trade Page is where users go when they want to get more information about a specific coin, set up auto orders, price alerts and buy or sell crypto. Currently it's undergoing changes for upcoming features, but the current version enables the user to check prices with minimal effort.
Monitoring the Current Experience
At each step of the flow, specialized software is set up to track the current user experience and to help us understand our users and what they really want and need. Alongside each new version, tailored tests and interviews are being made in order to preserve the user-focused design and UX.
Closing Comments
The product grew exponentially in the past year and has come a long way in terms of functionality, look and feel. It's still constantly evolving and expanding - the current features are being improved and many new ones are on their way to Prod.
I'm regularly monitoring the project, conducting user interviews and tests, analyzing the results and collaborating with Product in order to create the best possible experience for the user. Working with cryptocurrencies has definitely challenged me and opened my eyes to new horizons.